
 Launch
Budget and financial reporting
Real-time clarity and transparency on your project's budget health overal organization's financial health.
The best part of reporting in missionX is that it is completly automated with best-in-class dashboards and story-telling visualizations that come ready out-of-the box.
Below are just some of the options for viewing and analyzing fiancial data in missionX.

Project budget analytics
At-a-glance and deep-dive into your project's budget details. What's budgeted, estimates, actuals, expenses and a breakdown of where the budget is allocated.
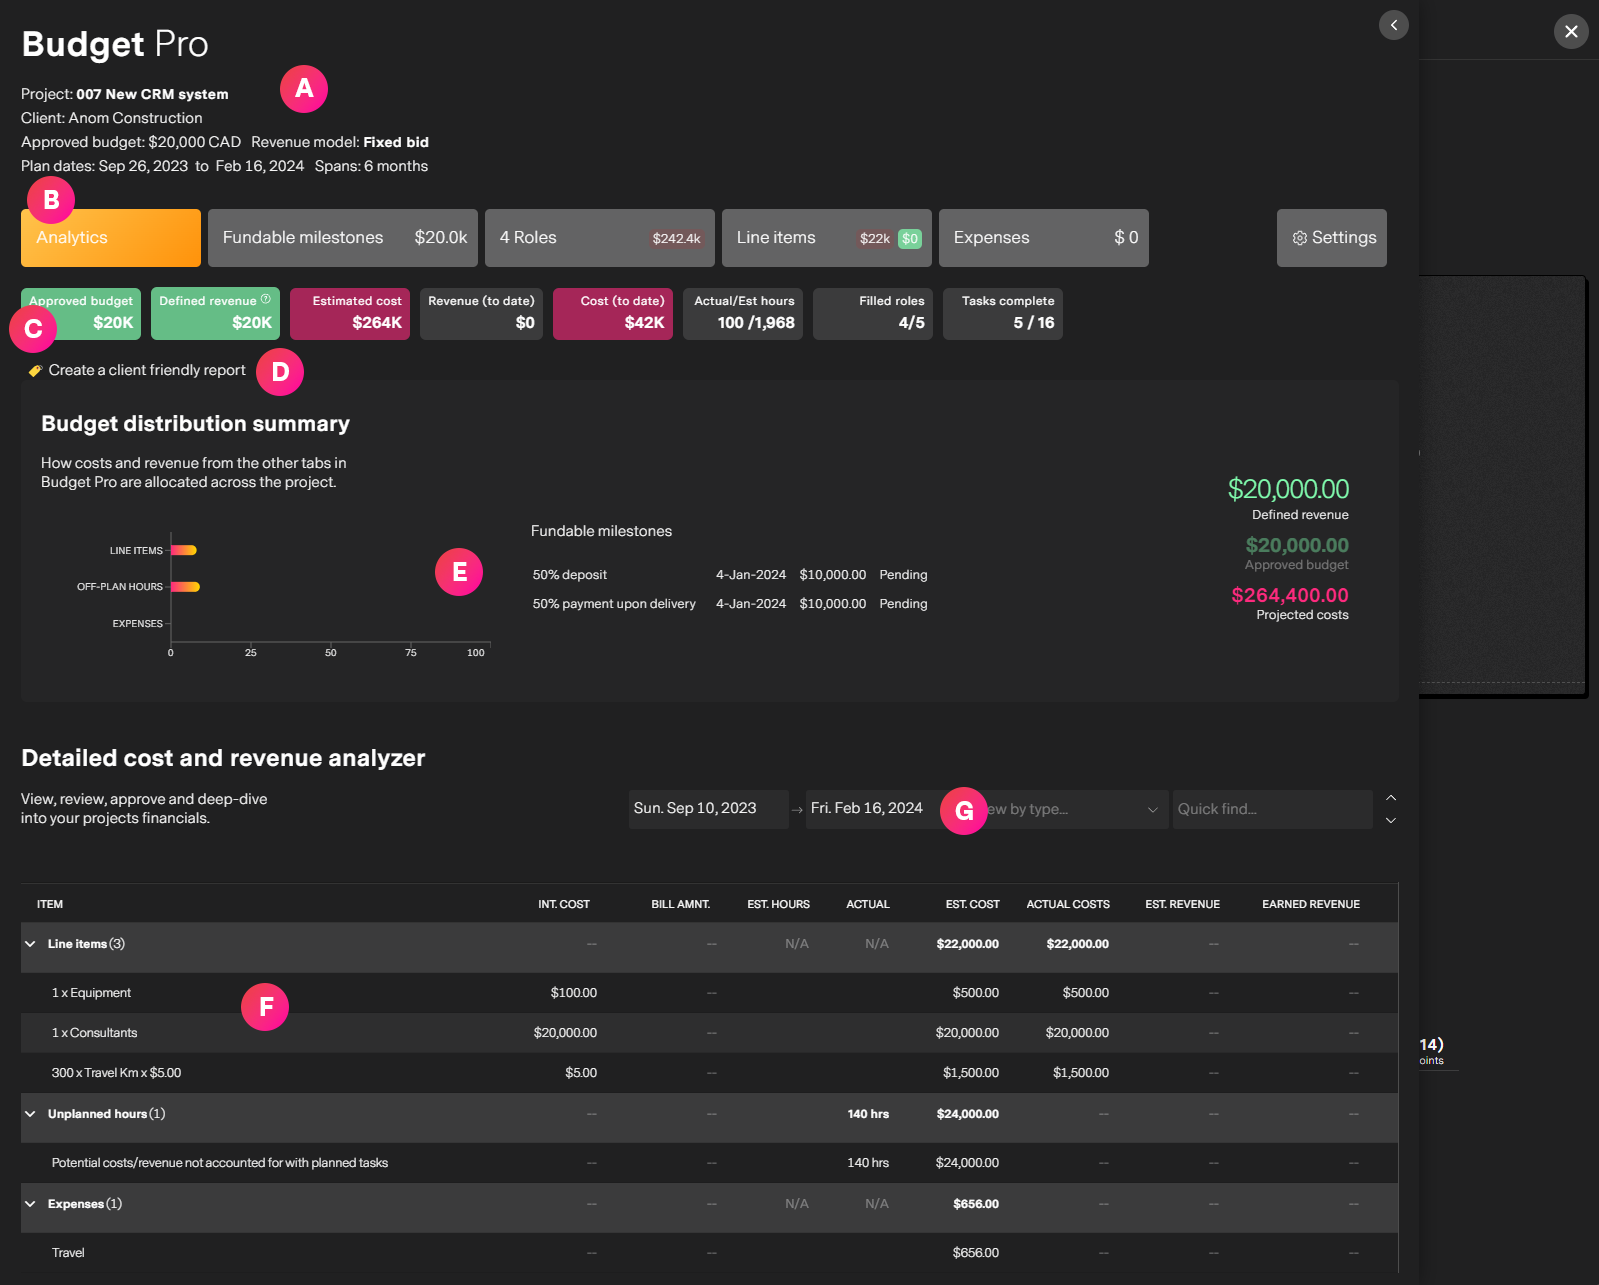
| Label | Feature | Description |
| A | Budget pro | Budget pro is your one-stop shop for all things related to project financials. It is accessible by a project manager or admin on Unlimited subscription projects |
| B | Analytics tab | Automated, real-time insights on your project's financial indicators. |
| C | Summary indicators | At-a-glance view of important budget indicators for your project's actuals vs estimated spending |
| D | Print report | Print a client friendly report that includes budget indicators |
| E | Distribution summary | See how spending and revenue is distributed across people, line-items, materials and expesnes. |
| F | Deep dive | A detailed view of all your project's spending and revenue. From timesheet hours to one-time and recurring expenses, even off-plan hours that are costing the project above and beyond estimations. |
| G | Refine the data | Narrow your data set by type of cost, timeframe, month, week or any period you wish so you can analyze spending and revenue within the context of time. |
Project manager's dashboard
Overseeing multiple projects makes analyzing each project individually too cumbersome so missionX organizes all your projects' key indicators in the Project manager's workspace
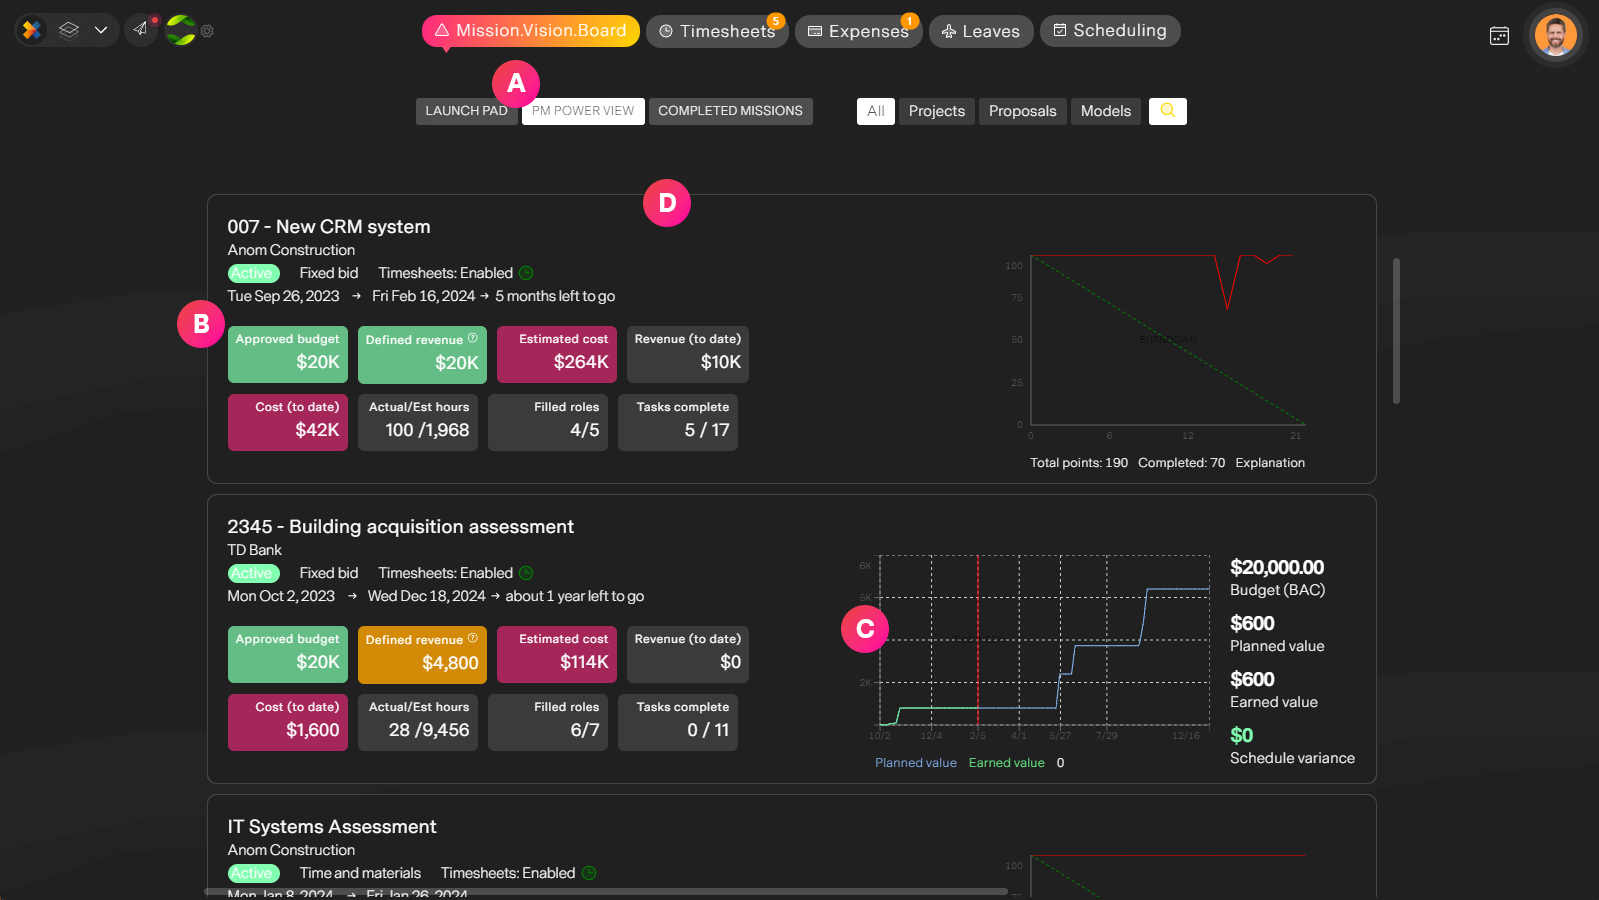
| Label | Feature | Description |
| A | PM Power view | From the Project manager's workspce select PM Power View to get a snapshot of all your projects key health indicators. |
| B | Key indicators | All your project's key health indicators. Spot budget overruns by keeping tabs on your actual vs forecast spending. By clicking on an indicator you can deep-dive into the specifics from within Budget pro. |
| C | Progress charts | If you are using MX-Gantt for Earned Value Management then you can monitor your schedule variance from here for all your projects. |
Client freindly report
Reporting for your project and tracking progress is extremly easy because it's done for you. With one click you can create a beutiful, sophisticated report for sharing with you're team, management or clients.
There are many ways to view reports in missionX but here we are looking at the Client report from your project workspace navigation bar.
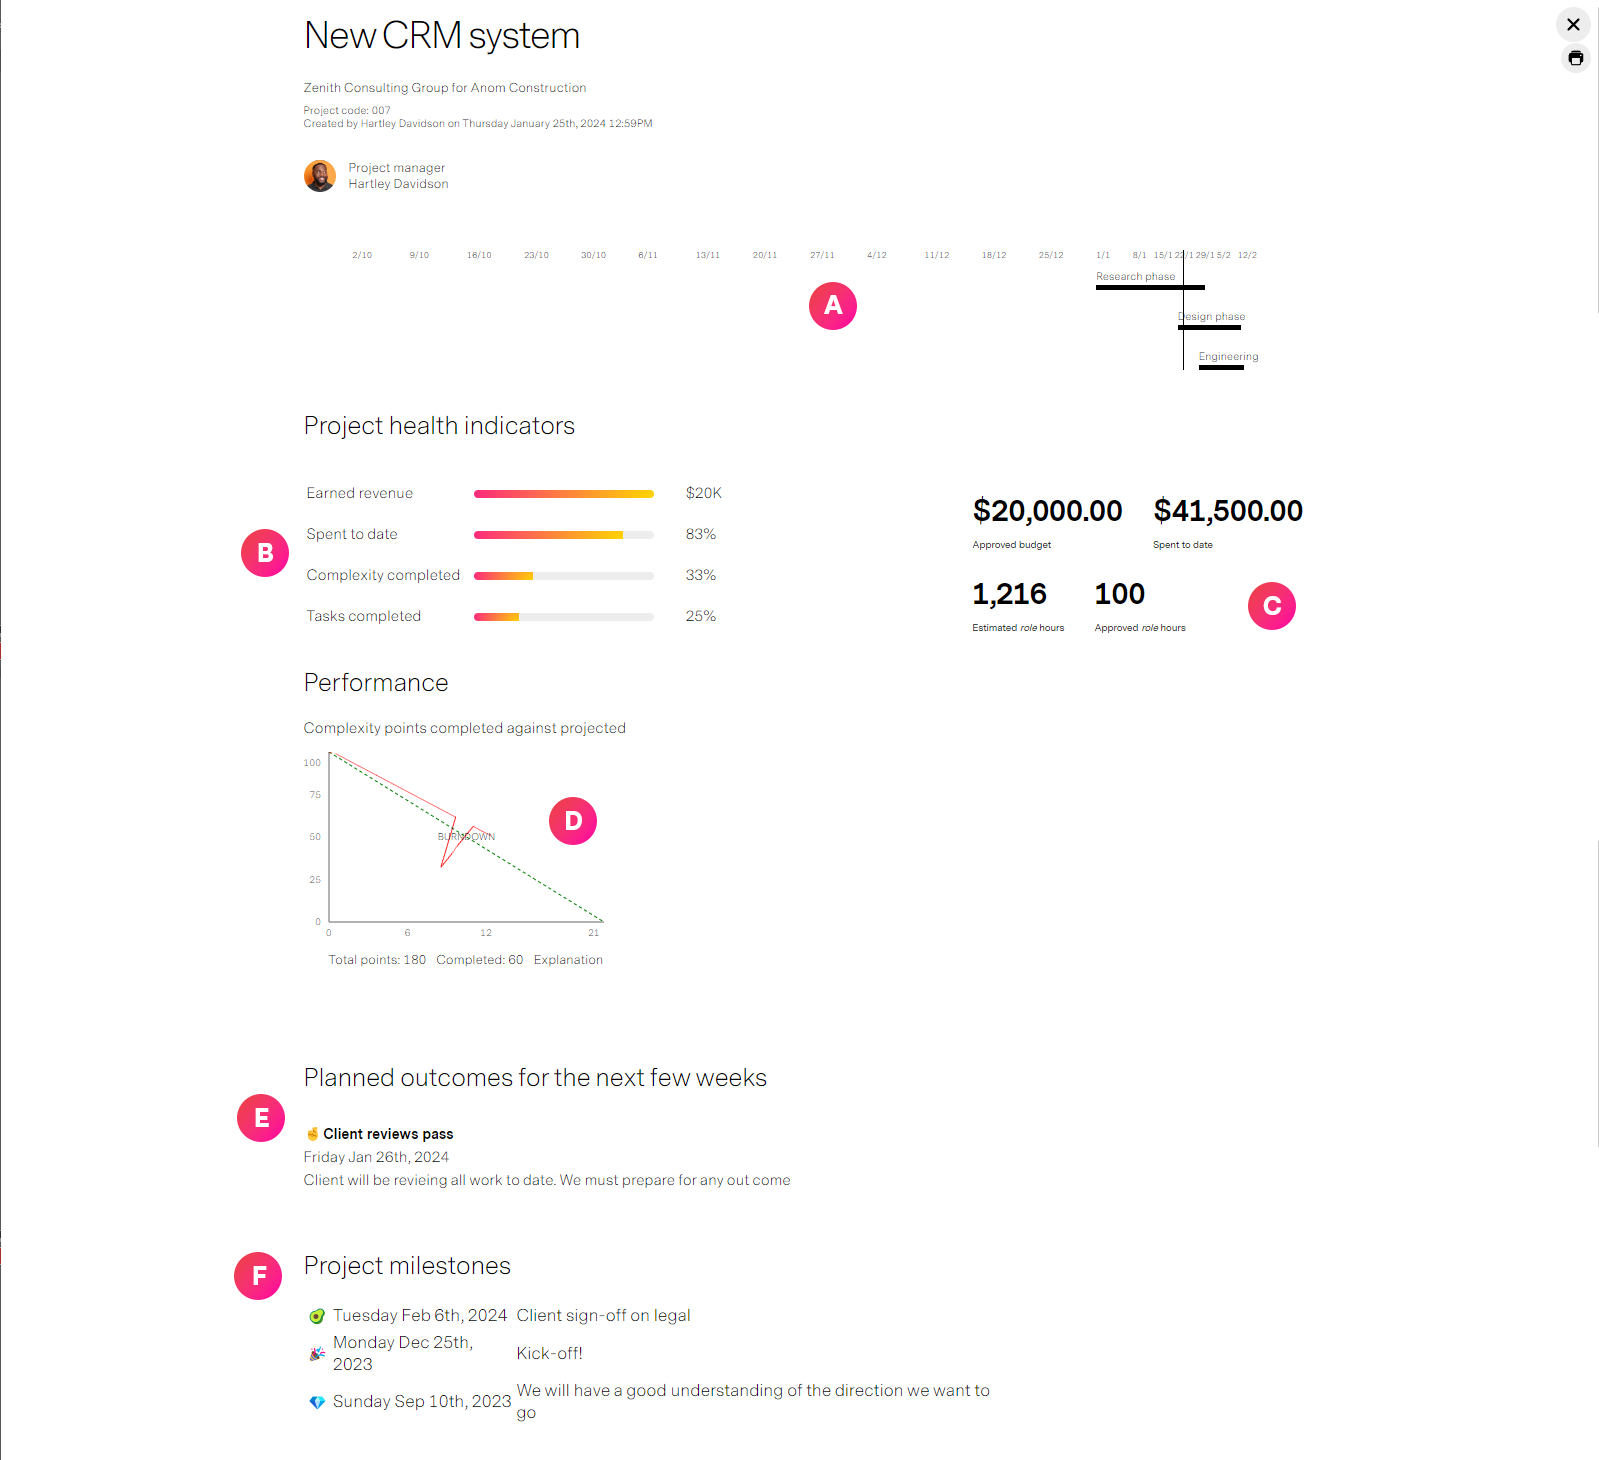
| Label | Feature | Description |
| A | Project timeline | If you have defined phases with dates in your Planning board then they will appear here to show completion progress |
| B | Health indicators | An overview of some key indicators like earned revenue (if the project is billable), spent to date (if you are tracking costs) and complexity completed. Complexity points define how much work is required to complete a task and allows you to guage how much effort will be required to complete remaining tasks |
| C | Approved vs Actual | For many client projects you will need to track performance against approved budget and hours. missionX summarizes it here for you by incorporating timesheet data if timesheets are enabled. |
| D | Burndown chart | Your Burndown chart represents the amount of work defined vs how much of that work has been completed. This is all based on Complexity points that are defined for each task and not the number of tasks. This is important because you may have 20 tasks left but they may all be extremly hard to complete and require a long time so number of tasks is not the best way to track work completion. The bottom axis is the weeks in your project, the Y axis on the left is how many complexity points are planned for. The middle green diagonal line is how many points need to be completed each week for you to deleiver on time. Now the red line is your burndown, how are you doing completing work on a weekly basis and at what rate you will finish. It should closely match the green line. It the red line is pointing before the green line great, you are finishing early but if the red line is trending to the right of the green line. you are heading for delays and you will need to complete more work to get it back on track. Structured Agile projects will show a Burndown chart for every workstream, POD or phase in your project |
| E | Outcomes | A summary of what you plan to accomplish in the next few weeks. |
| F | Project milestones | You can add milestones from your project timeline. These are different than outcomes in that they represent key momnets for your overall project like "Client sign-off", or "Go live" |
Financials for the business
Real-time automated financial information across all projects in the Organization including forecasts, actuals and invoices.
All project data is analyzed and transformed into a meaningful business friendly report that's easily understood by the CFO or the CEO.
No data-entry, no setup or coding. Just awesome insights in real-time.
missionX can handle and convert exchange rates to your organization's default currency. This allows you to normalize financial reports for you across different regions and currencies... when we say Enterprise capability, we mean Enterprise capability.
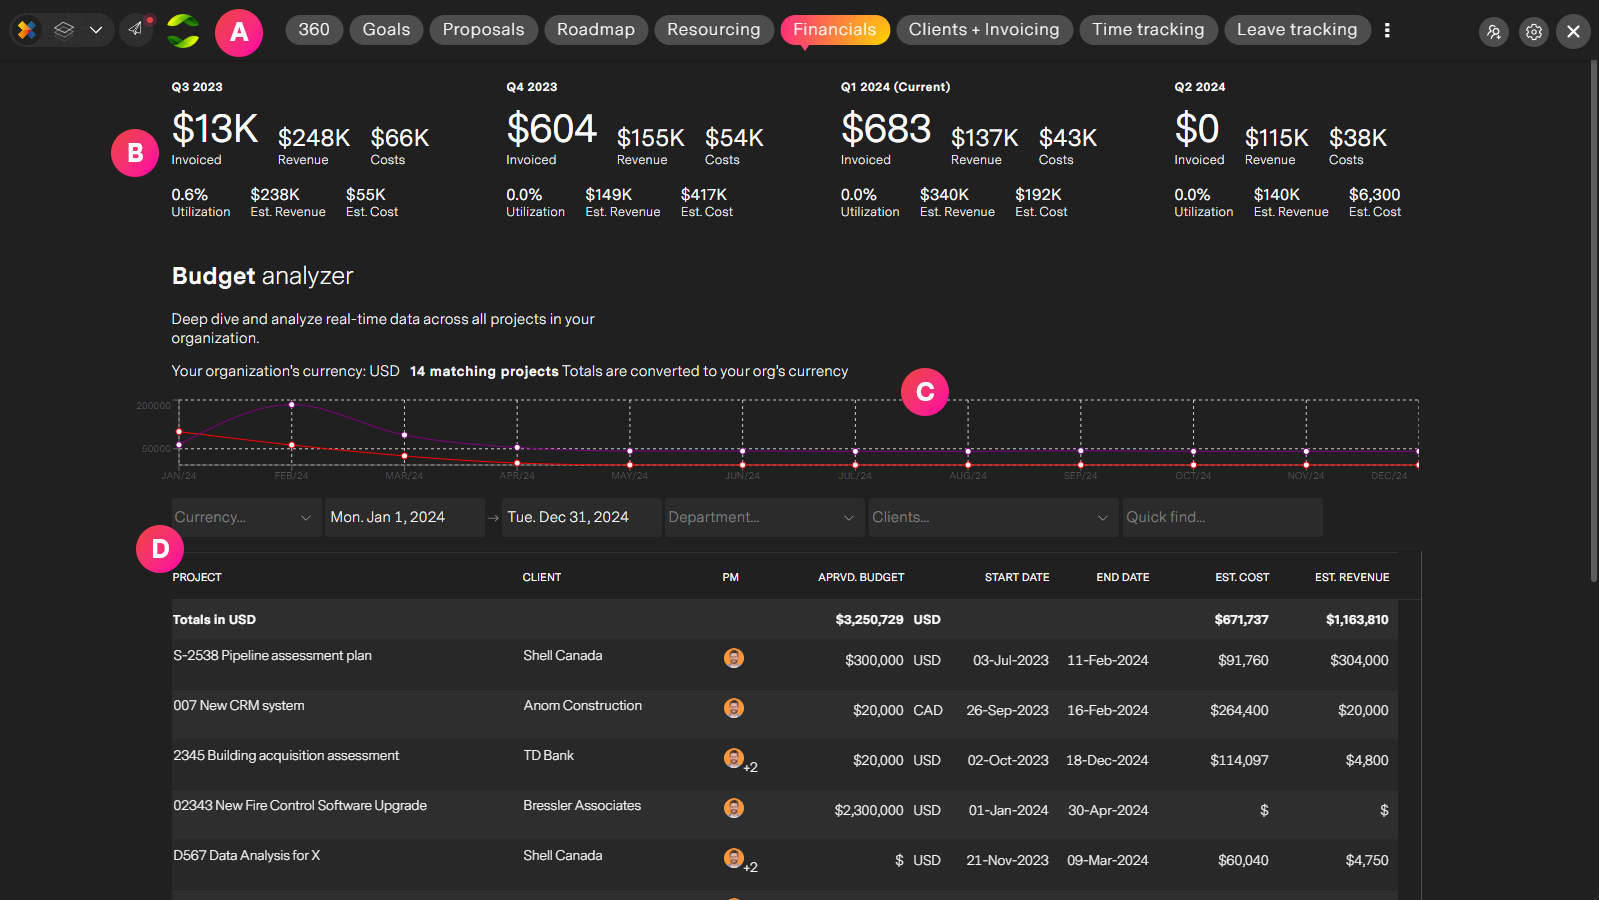
| Label | Feature | Description |
| A | Financials tab | The financials tab from your Organization's workspace summarizes financial information across the business. |
| B | Quarterly reports | Financials summarized into quarterly reports. Invoiced, revenue, costs, estimates and utlization |
| C | Monthly chart | See on a month-to-month basis how actuals vs estimates stackup. And keep track of forecast spending that could require more cash on hand. |
| D | Deep dive | Analyze the summary data at the project level. Track each project individually or refine your vide by departments, clients time frame and more. |