
 Launch
MX-Gantt
Decompose your project into Work packages and Activities to create your Work Breakdown Structure (WBS), sequence the work with dependencies and manage it all on a timeline. A sophisticated Gantt management workspace simplified for people not used to complex apps like MS Project™.
But this is missionX... the fun doesn't stop there! Estimate work packages and activities by hour or fixed bid, track hours and overtime right on your workboard and setup an automated activity process... and that's just for starters...
Built on PMI norms
MX-Gantt follows the terminology and process groups of the Project Management Institute (PMI®) and the PMBOK® Guide. If you are a certified PMP® (or working towards one) the workspace should feel familiar, because the tabs are laid out in the order PMI expects you to plan a project.
Why this matters: The language in missionX is now PMI language. What used to be called a Phase is a Work package, and what used to be a Task is an Activity. Work packages are the lowest level of the WBS, and activities are the scheduled work required to produce them — exactly as PMI defines them.
| PMI practice | Where it lives in MX-Gantt | Notes |
| Develop Project Charter / Business case | Analysis and Planning tab | Reason for the project, objectives, business case, goals and metrics, scope in / out, risks, constraints, assumptions and high-level requirements. |
| Identify Stakeholders (Stakeholder register) | Stakeholders tab | Internal/external classification, impact, goals and constraints per stakeholder. |
| Create WBS (decomposition) | WBS tab | A visual, numbered decomposition tree of work packages with automatic WBS codes (1, 1.1, 1.1.2 ...). |
| Define Activities / Sequence Activities / Estimate Duration | Project timeline tab | Activities under each work package, finish-to-start, start-to-start (with lag) and finish-to-finish dependencies. |
| Develop Schedule (Critical Path Method) | Project timeline tab | missionX calculates and highlights the critical path 🔥 through your dependency network. |
| Plan Resource Management (RACI matrix) | Resource view tab | Responsible, Accountable, Consulted, Informed assignments per activity, rolled up by role. |
| Schedule and Cost baselines | Baselines panel + BL columns | Snapshot effort, duration and cost, then compare the current plan against any baseline right in the grid. |
| Control Costs (Earned Value Management) | Project report | PV, EV, AC, SPI, CPI and forecasting calculated automatically from your plan. |
Advantages of MX-Gantt
- Familiar timeline and dependency based planning
- Track timelines based on dependencies and the critical path
- Organize your work in a hierarchical tree structure (WBS) with automatic WBS numbering
- Track work progression as percent complete and activity process steps
- Estimate cost and duration at the activity or work package level (bottom up estimation)
- Plan the project before it starts in Planning mode, then shift the whole plan to the real start date on kick off
- Baseline the plan and measure drift against it
Tour the MX-Gantt workspace
Shown in both Dark and Light modes. Both are supported, you decide.
Tip: Click on an image to zoom.
- The Project plan
- Budget Pro
- Timesheets Pro
- Project Report
- Comments/Discussions
- mission DOCS
- Process Flow Maker
- Manage the project team
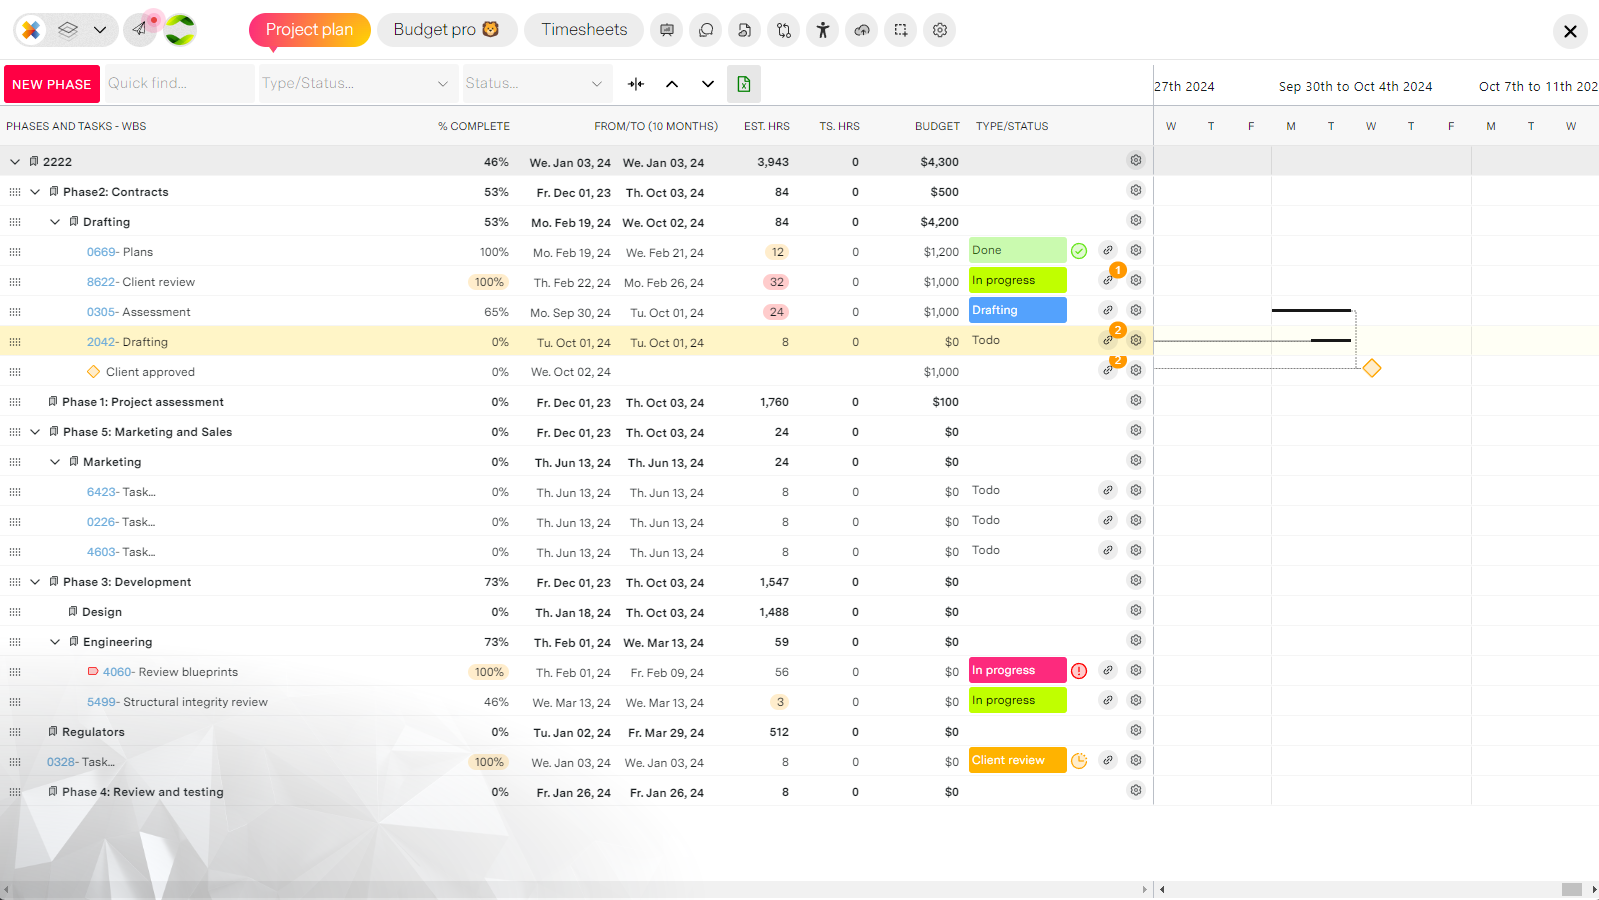
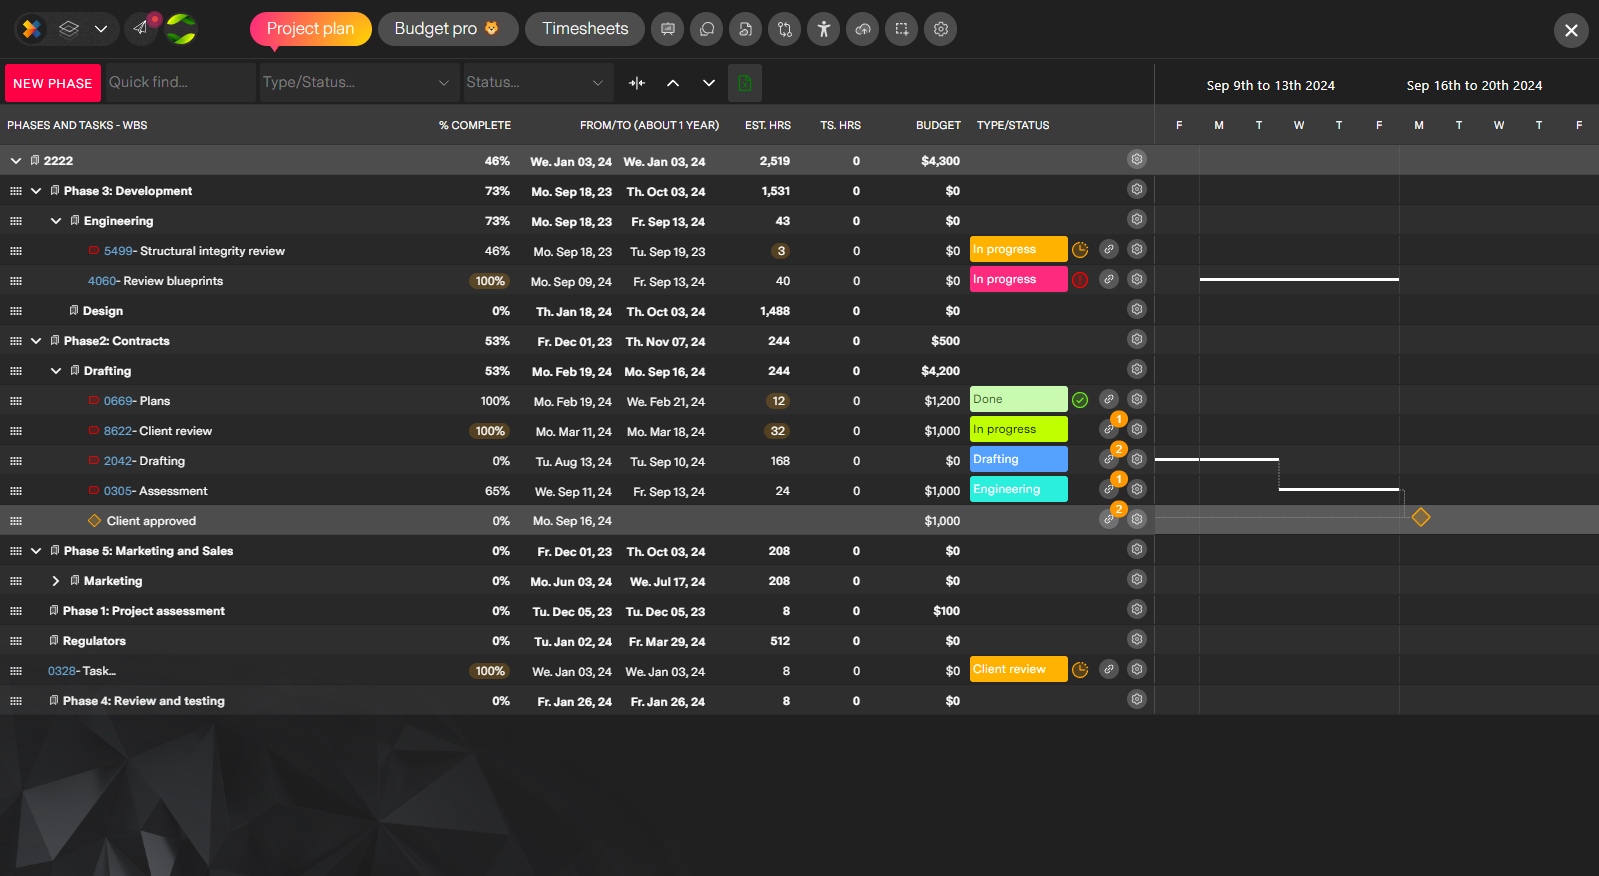
The Project plan
Organize your project into work packages and activities, control start dates, end dates, actual hours vs estimated hours, see OT hours, bottom-up budgeting, dependencies, % complete and optionally track where activities are in a process.
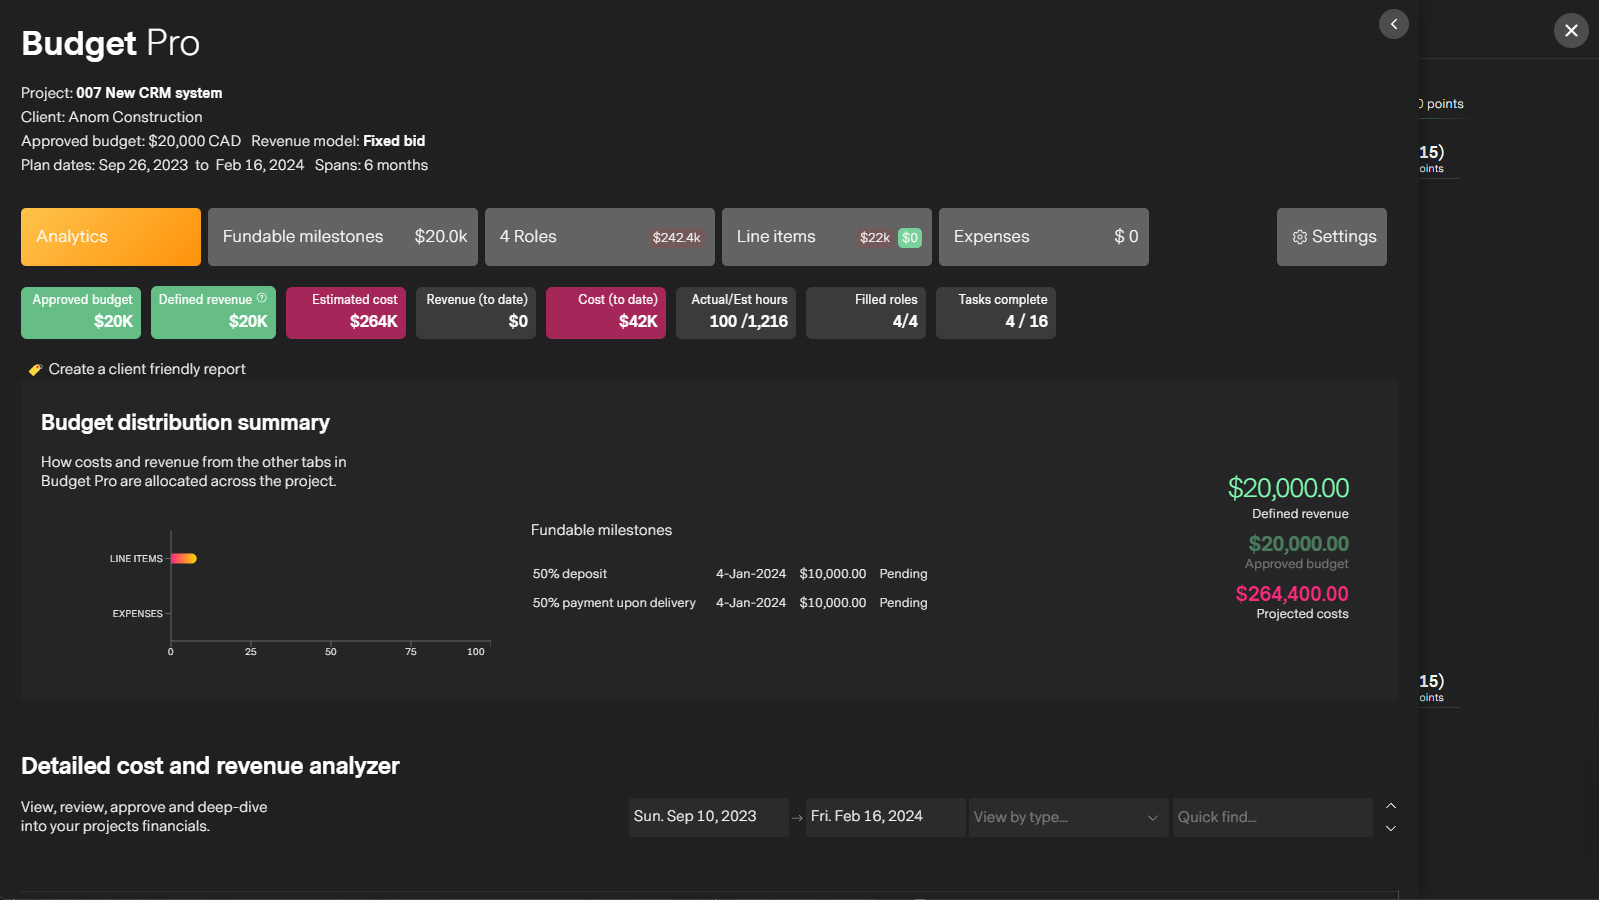
Budget Pro
One stop shop for managing your project budget and project roles. Automated reporting, fixed-bid fundable milestones, expenses, costs, revenue items, bill rates, retainers can all be defined and tracked here.
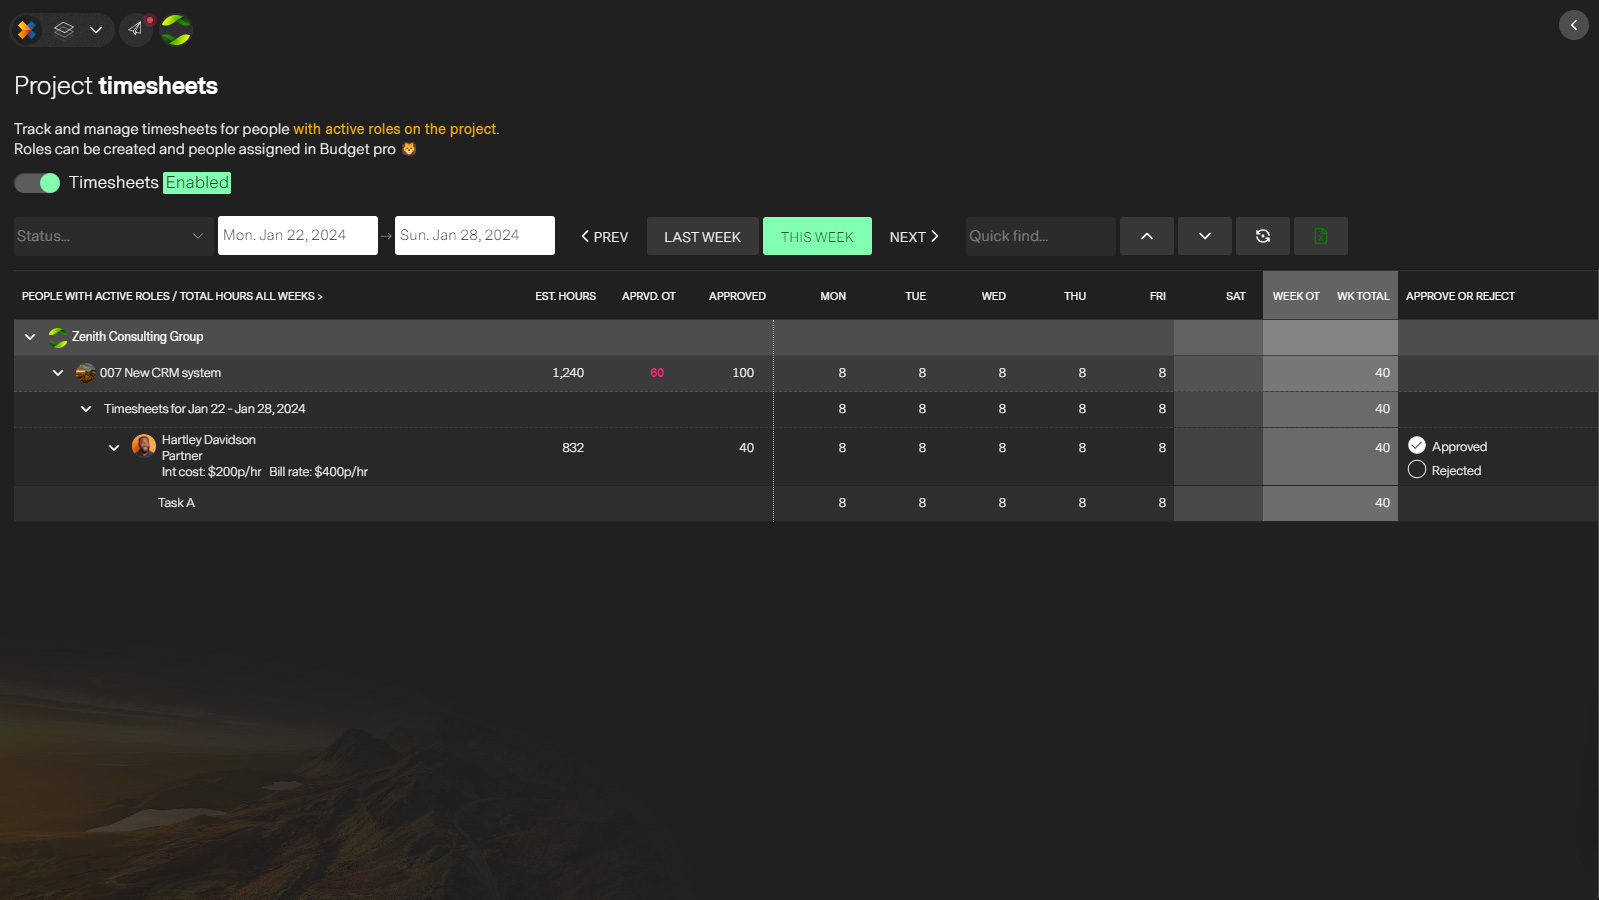
Timesheets Pro
Manage and review timesheets directly from within the project or across all projects from The PM Workspace. See overtime, missing timesheets and

Project Report
View and print a stunning, real-time report with key metrics and details spanning progress, timeline, financials and team productivity. It also happens to be client friendly.
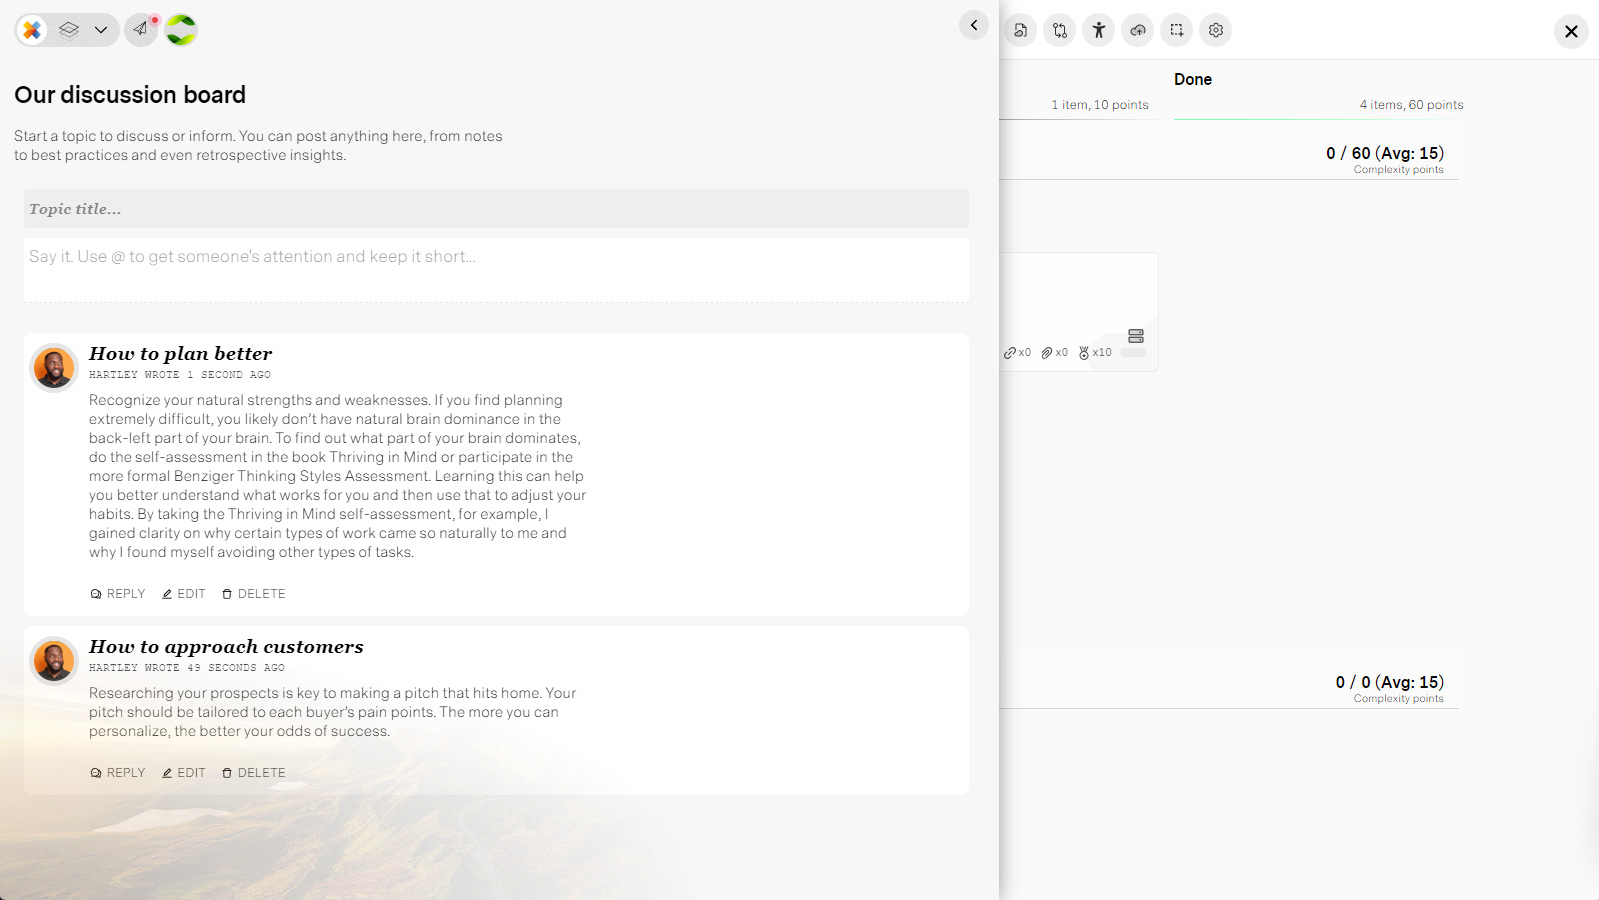
Comments/Discussions
Create discourse, solve problems, and create topics for learning and training within your project workspace. Knowledge becoems contextual and easily access by everyone. One less app to worry about.
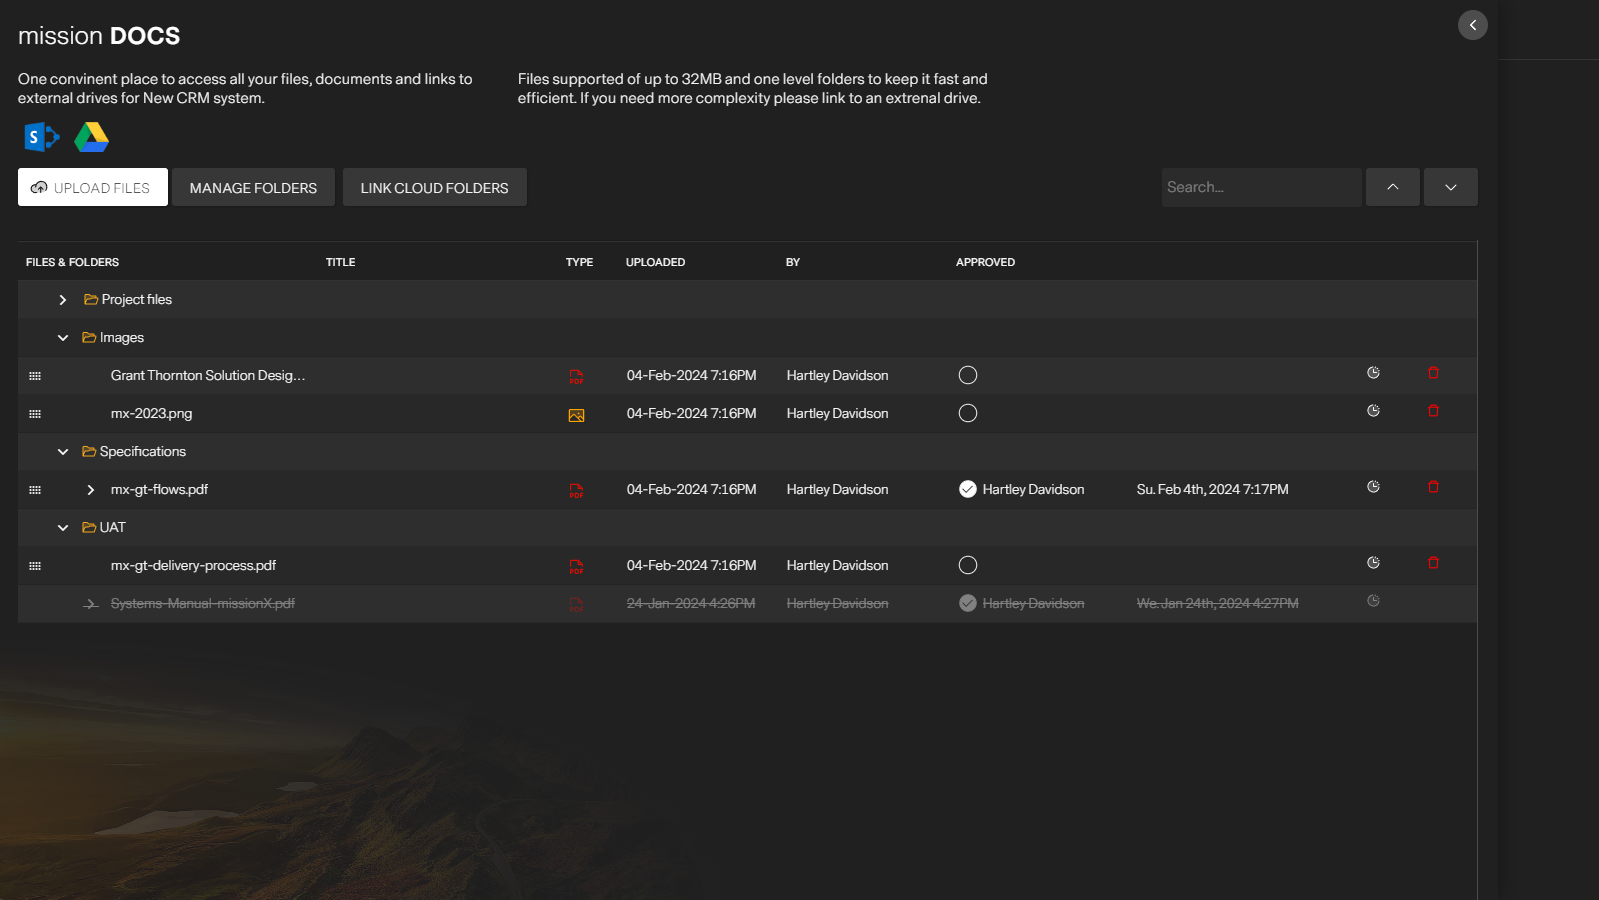
mission DOCS
Manage project files, document versions and approvals in missionX or add links to external drives and folders for easy access from tasks or the document's panel
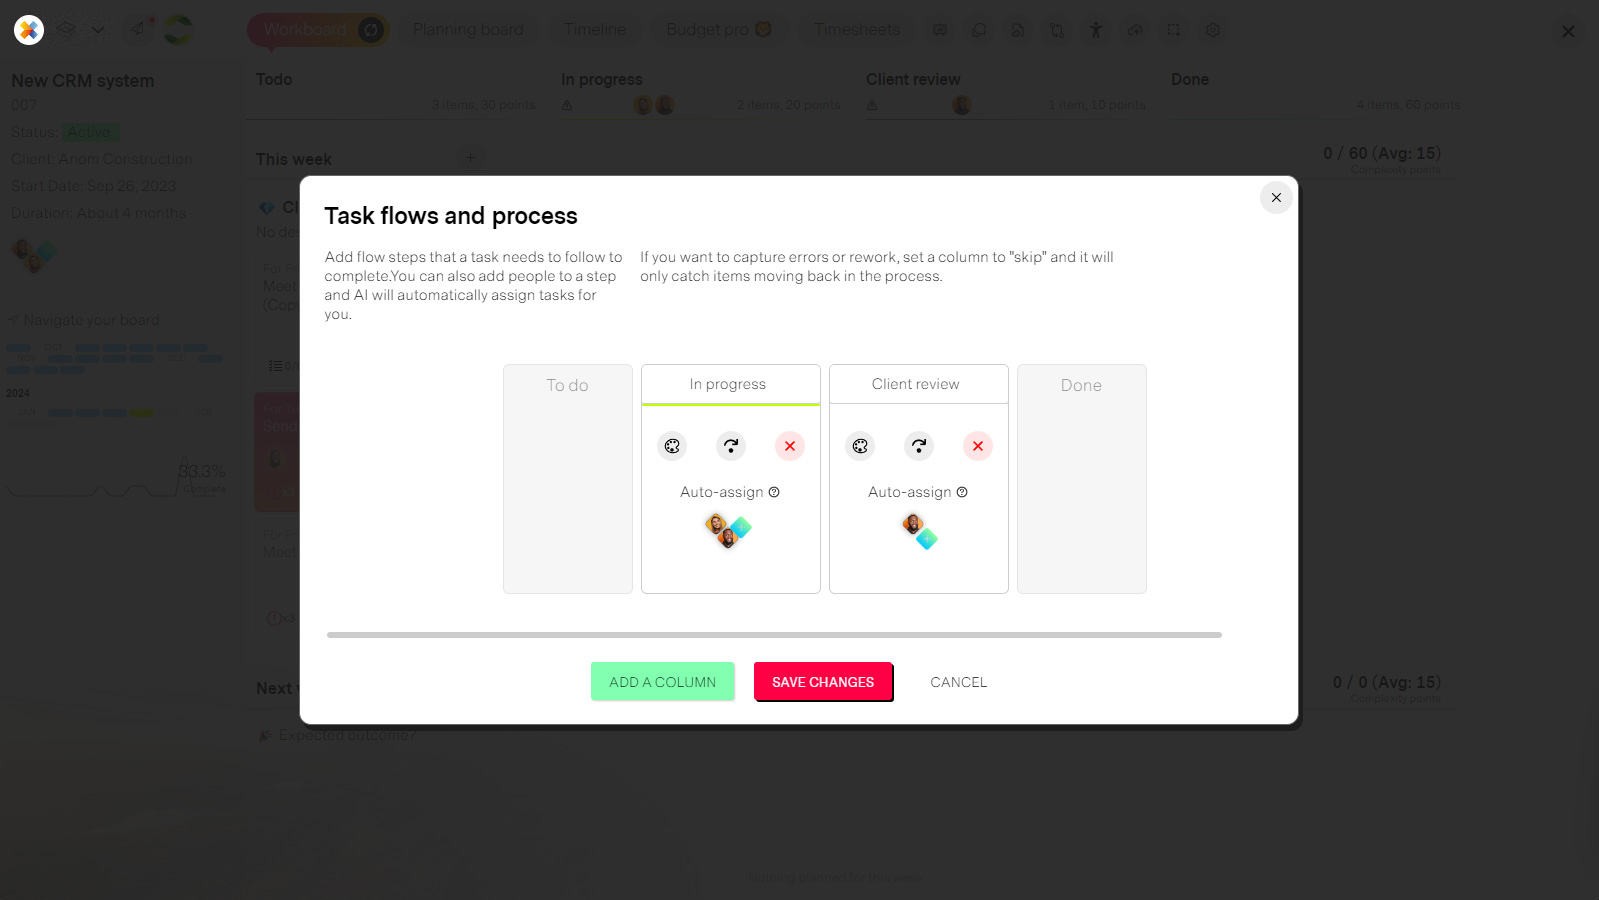
Process Flow Maker
Manage your projects process flow. Add a title for each step, assign a color and optionally define who should automatically be assigned tasks when they land in their column. You can also set a column to skip forward and only capture steps going back in the process like "Re-rework" or "Changes needed"
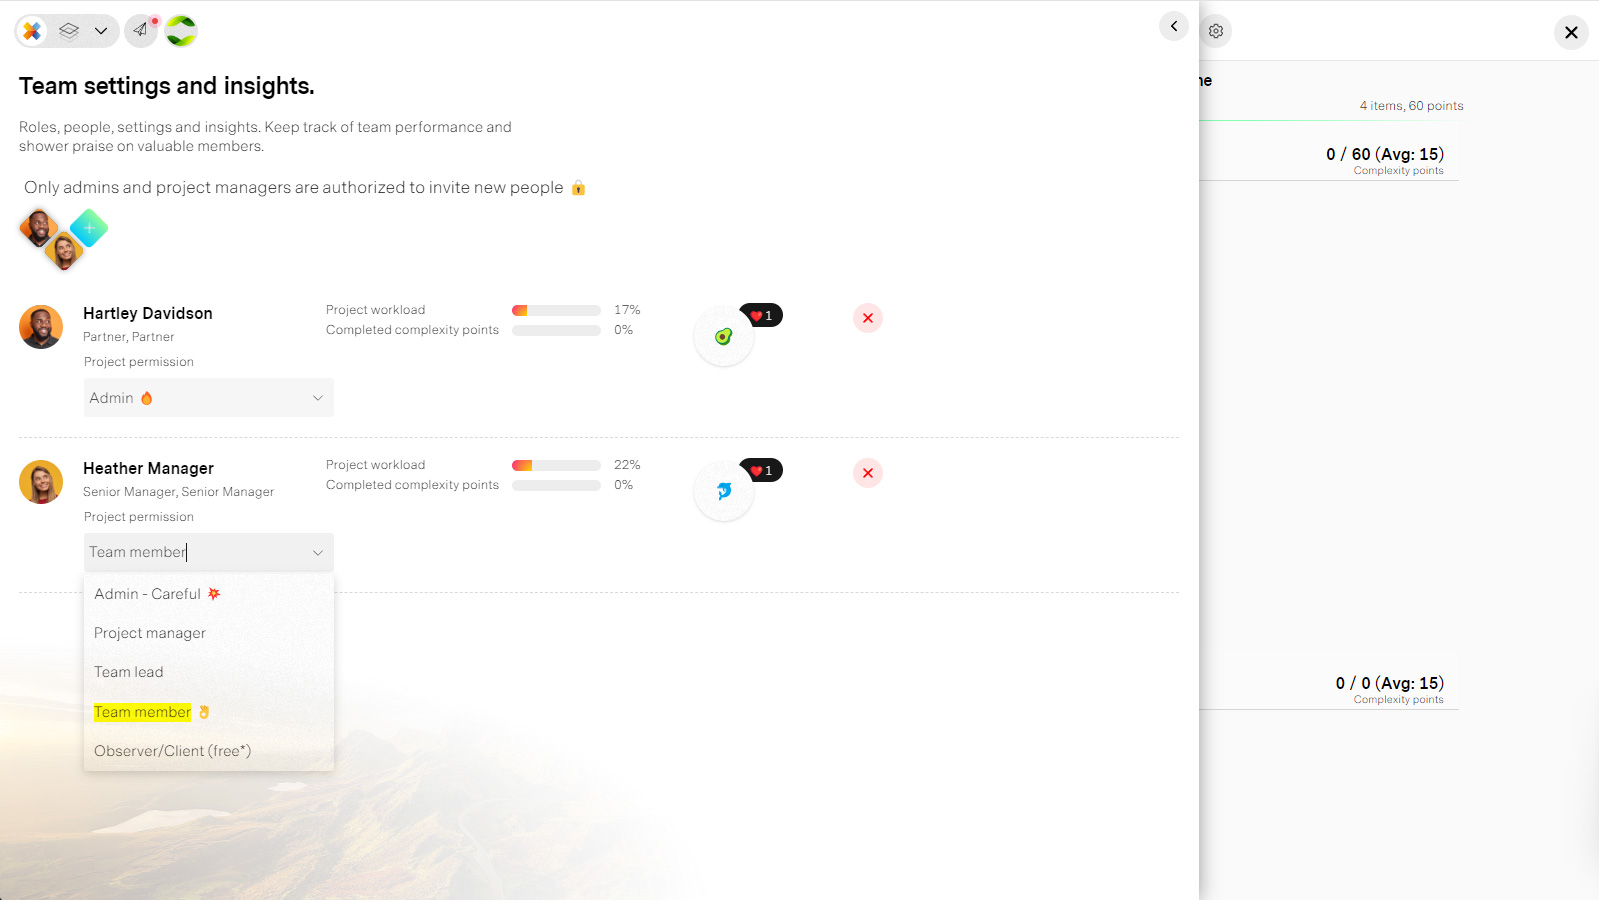
Manage the project team
A complete view of your team where you can manage permissions, shower praise for hard work and see each person's workload
The five project tabs
An MX-Gantt project opens on five tabs that walk you from "why are we doing this" all the way to "who is doing it". missionX remembers the last tab you were on per project.
| Tab | Purpose | Description |
| Analysis and Planning | Project charter | Capture the reason, objectives, business case, goals, scope, risks, constraints, assumptions and high-level requirements before you build the plan. See below |
| Stakeholders | Stakeholder register | Who has a stake in the outcome, how much impact they have, what they want and what limits them. |
| WBS | Decomposition tree | A visual top-down tree of your work packages with WBS codes, percent complete and budget roll-ups. |
| Project timeline | The schedule | The Gantt grid and timeline. Packages, activities, milestones, dates, dependencies, estimates and actuals. |
| Resource view | RACI / resourcing | Every role on the project with the activities they are Responsible, Accountable, Consulted or Informed on. |
Analysis and Planning
For project managers
This is your project charter. Each section is a rich-text block you fill in with your team, and missionX tracks how complete the charter is as you go. The sections are grouped into Business analysis and Project planning.
| Group | Section | What to capture |
| Business analysis | Reason for the project | Why are we doing this? Define the problem, opportunity or business need. |
| Business analysis | Project objectives | What do we hope to achieve? |
| Business analysis | Business case | Describe the expected benefit to key stakeholders. |
| Business analysis | Goals / Metrics | What does success look like and how will we measure it? |
| Project planning | High-level scope | Briefly summarize what is in scope for this project. |
| Project planning | Not in scope | Note the key items that will not be part of this project's scope. Your best defence against scope creep. |
| Project planning | Risks | Known threats and opportunities to the project. |
| Project planning | Constraints | Fixed limits on time, money, resources or approach. |
| Project planning | Assumptions | What you are taking as true in order to plan. |
| Project planning | High-level requirements | Capture the high-level needs that will be used to create your WBS. This is the bridge into the WBS tab. |
Tip: Write the high-level requirements first, then create one work package per requirement group in the WBS tab. Your decomposition will be traceable back to the charter, which is exactly what PMI's scope management asks for.
Stakeholder register
For project managers
Documenting stakeholder needs, goals and constraints ensures everyone shares a clear understanding of what is required, what success looks like and what limitations must be respected. It aligns expectations, supports decision making and minimizes miscommunication and scope creep.
Press Add a Stakeholder and complete the row. Each stakeholder captures:
| Field | Values | Description |
| Stakeholder | Free text | The person, group, department or organization with a stake in the outcome. |
| Contact info | Rich text | How to reach them. You can add links, mentions and formatting. |
| Type | Internal / External | Internal stakeholders show in green, external in red so you can scan the register quickly. |
| Impact | High / Medium / Low | How much influence this stakeholder has over the project. Colour coded red, orange and mint. |
| Goals | Rich text | What does this stakeholder need the project to deliver? |
| Constraints | Rich text | What limits do they impose? Budget ceilings, deadlines, compliance rules, technology standards. |
Work Breakdown Structure
The WBS tab is a visual, top-down decomposition tree of your project. The project sits at the top and every work package hangs beneath it, numbered with a proper WBS code (1, 1.1, 1.1.2 and so on) that is recalculated automatically as you restructure.
For project managers. Everyone else sees the tree read-only.
| Control | Feature | Description |
| Project node | Top of the house | The root of the tree showing the project title, budget, estimated cost, estimated revenue (billable projects) and overall percent complete. Adding a package here creates a root level work package, the first level of your decomposition. |
| Package node | Work package | Shows the WBS code, title, the number of activities inside it and its percent complete with a progress bar. Click the node to open the package details card where you can rename it, set its RACI team and review progress of everything beneath it. |
| + Add | Add a new Package below | Decomposes the selected package by adding a child package one level down. |
| Insert | Insert a Package between | Slides a new package in between this one and its children. The existing children are re-parented to the new package, which is how you add a level of decomposition without rebuilding the branch. |
| ← / → | Move this left / right | Reorders the package among its siblings. The WBS codes renumber immediately. |
| × (orange) | Delete just this Package | Removes the package but promotes its children up to the parent. Use this to flatten a level of your hierarchy without losing work. |
| × (red) | Delete this package and all child Packages | Deletes the whole branch, including every package and activity under it. This cannot be undone. |
Tip: The WBS tab is for shape — how the work decomposes. For deeper nesting, sorting and anything to do with dates, drag and drop packages and activities on the Project timeline tab.
The Project timeline
Your planning board, where you create and manage work packages, sub-packages, activities and milestones against a calendar.
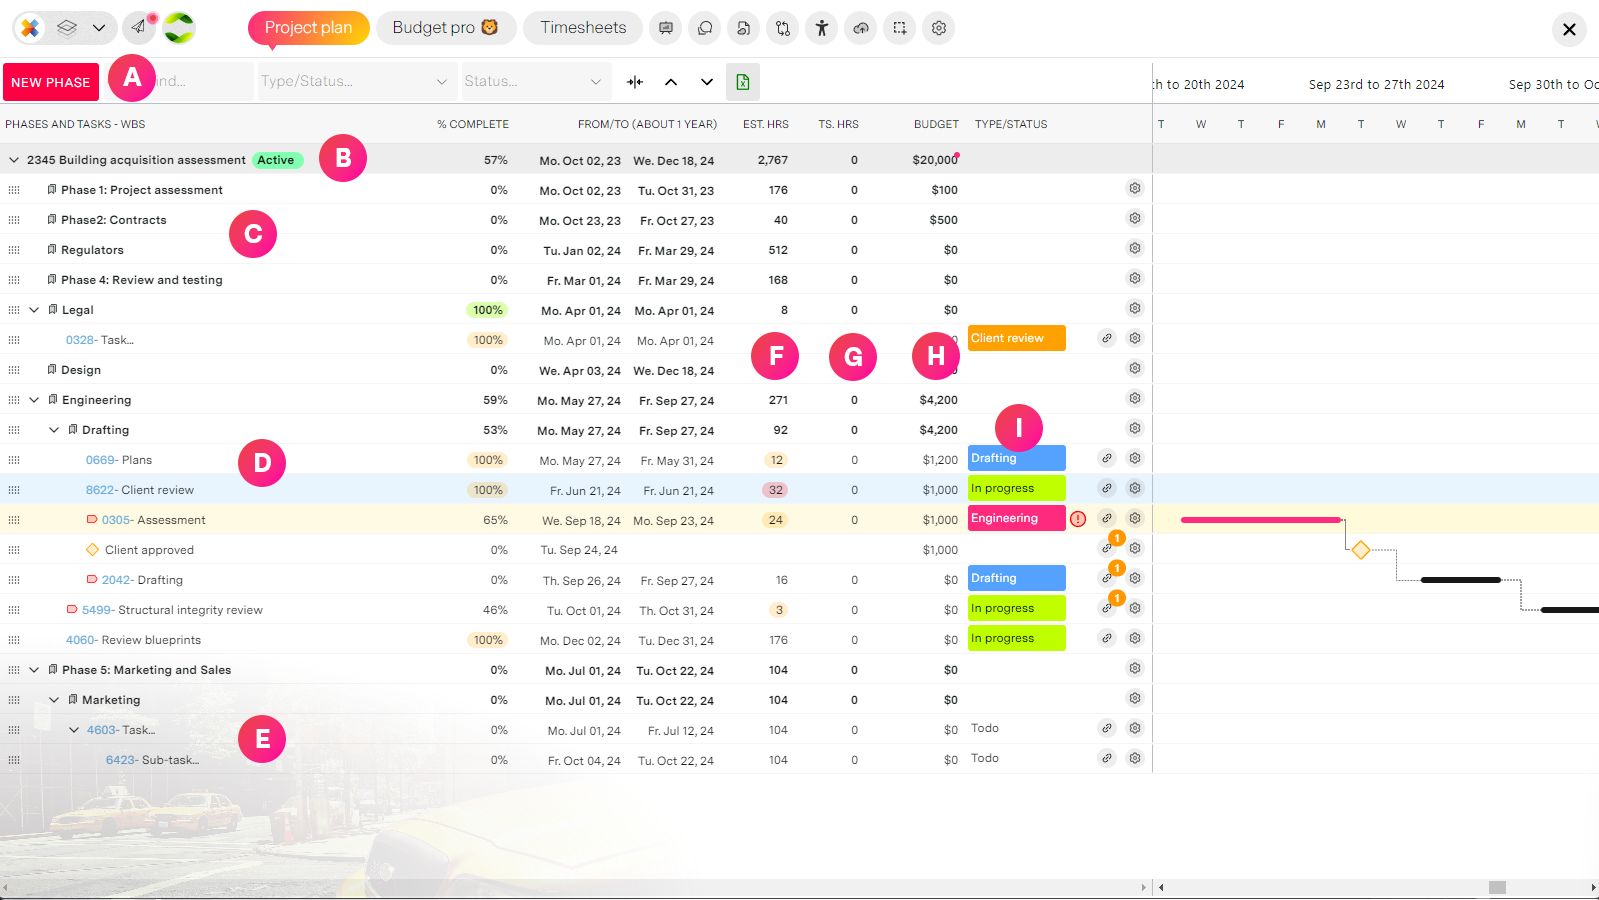
| Label | Feature | Description |
| A | Create a work package | Creates a root level work package under your project row. You can then move it, nest it, add activities to it and manage it as you wish. You can also add packages and sub-packages from the gear icon at the end of each row. |
| B | Project summary row | The project's top-of-the-house row. This aggregates all package and activity data under it. This cannot be deleted. Fun fact, the budget here can be set manually or rolled up from estimates at the activity and package levels. |
| C | Work packages | Work packages are in bold with a bookmark icon next to them. They allow you to organize activities into deliverable-oriented groups. Packages can be dragged and dropped into other packages to create a parent/child hierarchy. To move a sub-package back to the root, simply drop it onto the project summary row at the top of the list. Click the title to edit the package name and the gear icon (see below) to manage everything else. |
| D | Activities | Activities can only be part of a work package and have an id next to the title that opens the activity details workspace. Activities can be moved to other packages or dropped on other activities to create sub-activities. Click the activity id to edit details and the gear icon (see below) to manage everything else. |
| E | Sub-activities | Sub-activities provide a visual representation of work grouped in a hierarchy, but this does not mean that a sub-activity will alter the parent activity's dates. To make a sub-activity a root activity simply drop it on the same, or another package. |
| F | Estimating hours | You can estimate hours for your activities by entering hours manually or just have missionX calculate based on the number of business days multiplied by 8 as the default. |
| G | Timesheet hours | missionX automatically shows you the actual hours from your timesheets against the estimated hours. Super useful for preventing delays and cost overruns. This requires that you have timesheets enabled. |
| H | Estimating cost | Displays aggregate or fixed cost amounts for activities and packages. Selecting it opens the estimation panel described below |
| I | Activity status and process | View and change the status of your activity as it moves through the process or declare a substatus like "Blocked" or "Overdue". See Categorize work for more details |
Timeline toolbar
The controls above the grid let you shape the view without changing the plan.
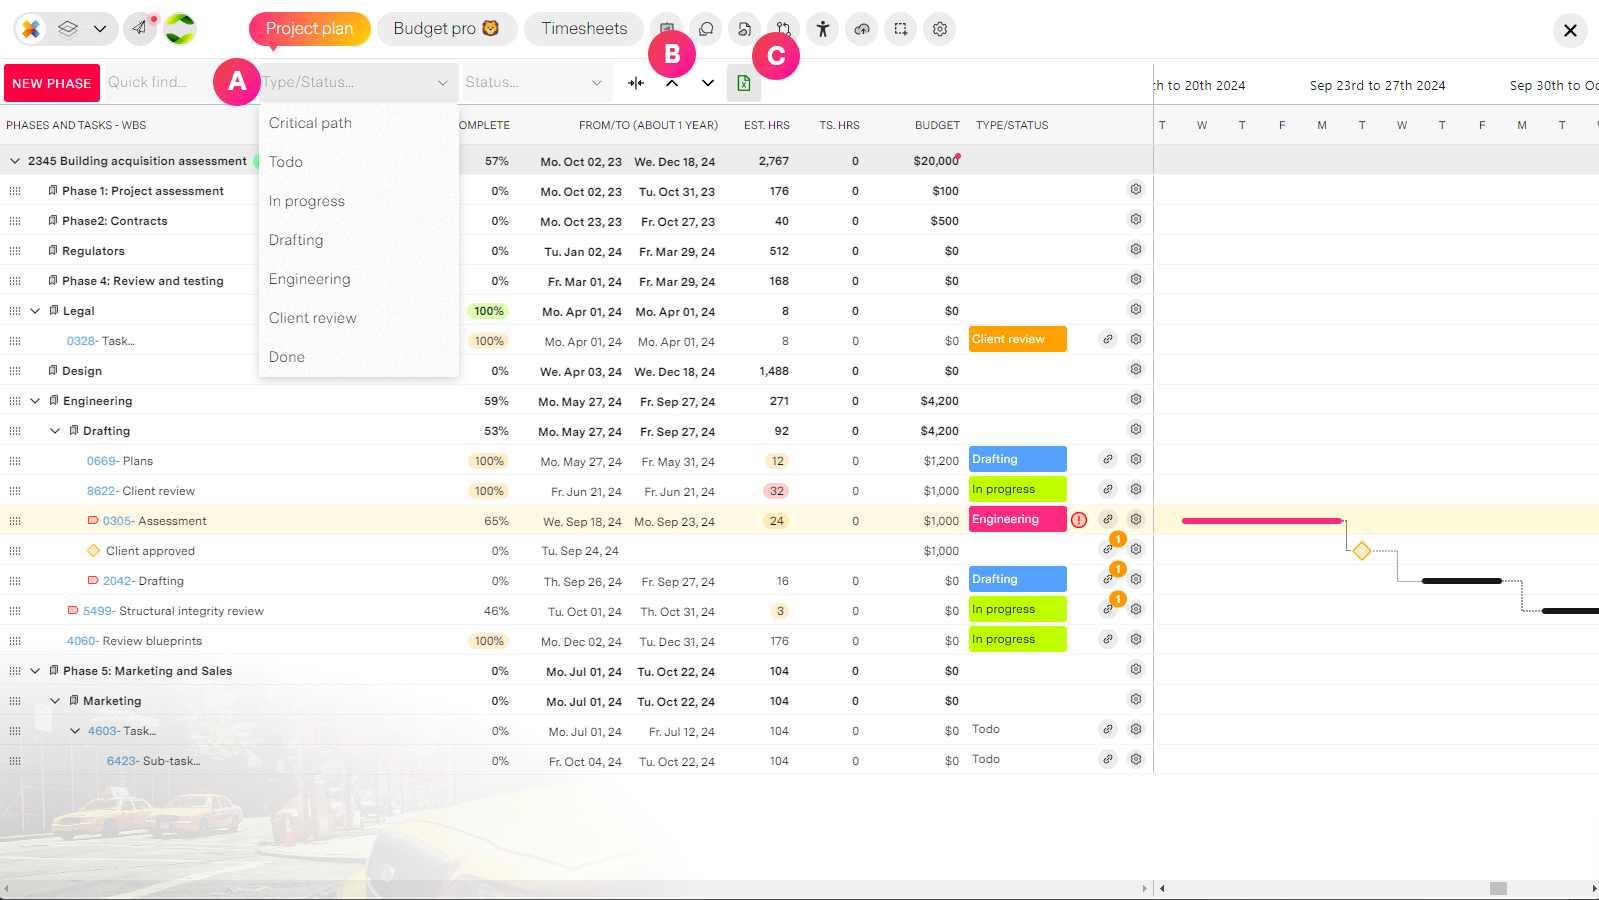
| Control | Feature | Description |
| Add a work package | Adds a top level work package to the project. For sub-packages and activities use the gear icon on the row. | |
| Start the Project | Only shown while the project is in Planning mode. See Working with dates. | |
| Day / Month | Timeline zoom | Switch the timeline between Day view and Month view. In month view estimates are shown as days instead of hours. |
| Columns... | Column chooser | Show or hide column groups in the grid:
Any baseline you have saved also appears here. Pick one and the grid adds BL-Start, BL-End date and BL-Hrs columns so you can compare the current plan to the baseline. |
| Quick find... | Search | Filters rows across every column, including hidden ones. Works while you are in dependency mode. |
| Type/Flow... | Process filter | Filter to activities sitting in specific steps of your process flow. |
| Status... | Sub-status filter | Narrow to Blocked, Overdue or Done work. |
| Date period | Period selector | On projects longer than two months, restrict the view to a date window. Clear it with the red ×. |
| Expand / collapse timeline | Full view | Hides the grid columns to give the timeline the full width, then brings them back. |
| Chevrons | Collapse all / Expand all | Collapses or expands the whole WBS tree. missionX remembers the expansion state per project. |
| Excel | Export | Exports the visible rows, with your filters and sort applied, to Excel. |
Control menu: Work packages
Expand your work package by adding activities, sub-packages and milestones. You can also duplicate it, compress it and delete it.
For project managers
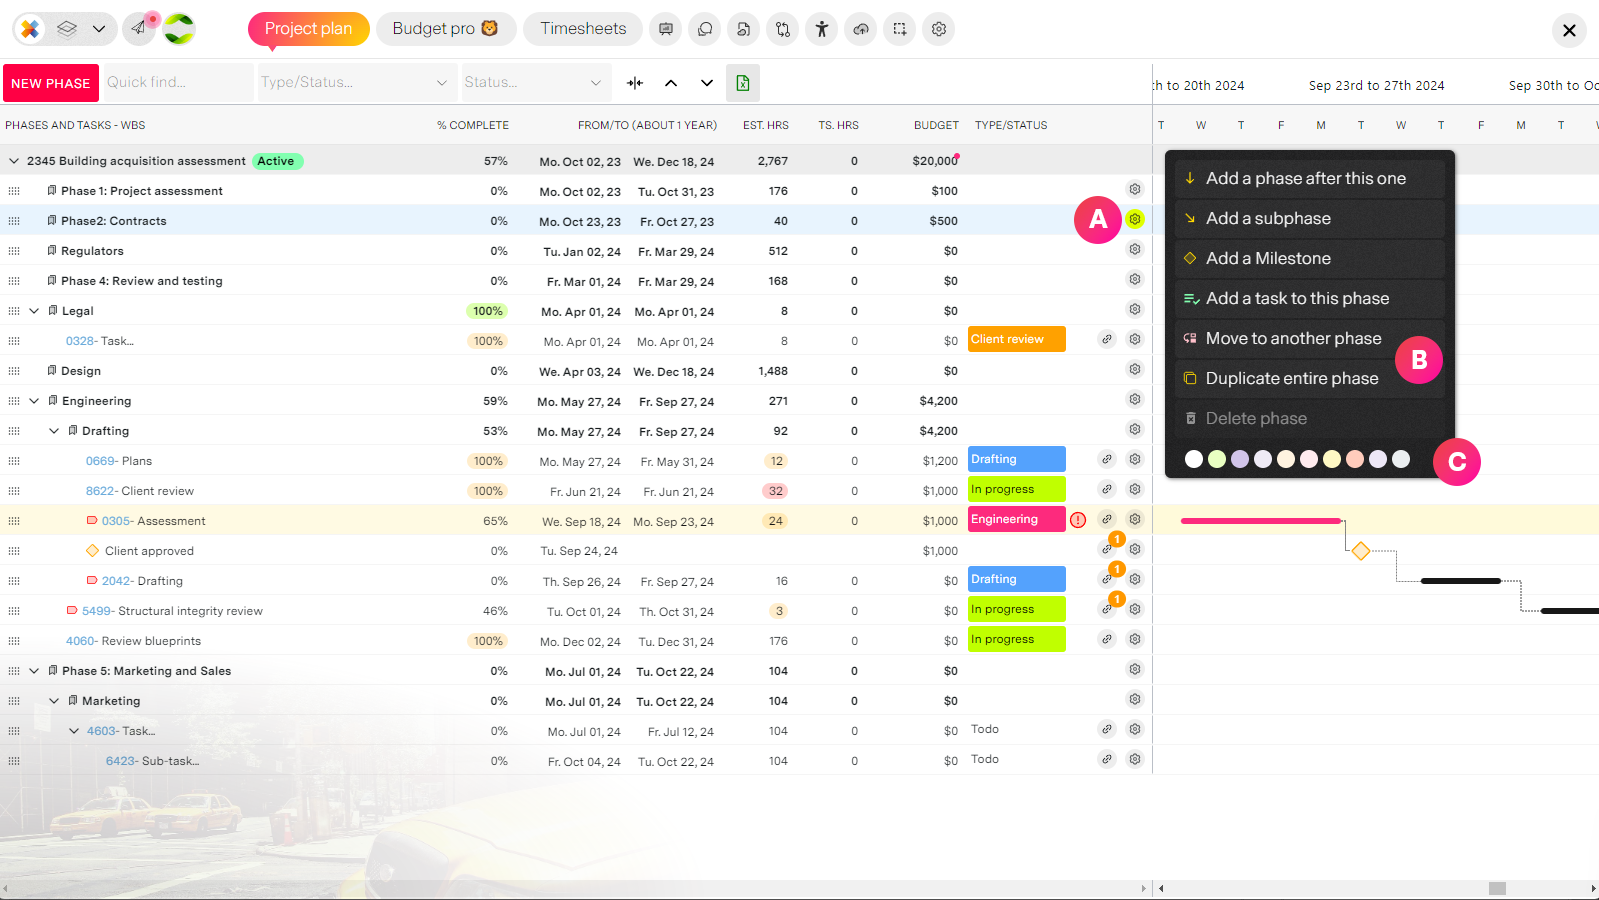
| Label | Feature | Description |
| A | Package menu | Hover your mouse over the gear to access the package menu No need to click, just mouse over the icon. |
| B | Options |
|
| C | Package colors | You can set a color for your package here. It is helpful for differentiation or if you want to highlight a status like complete, issue, warning etc. |
Control menu: Activities and milestones
Add activities around this one, wire up dependencies, duplicate it, and view a dependency map.
For project managers
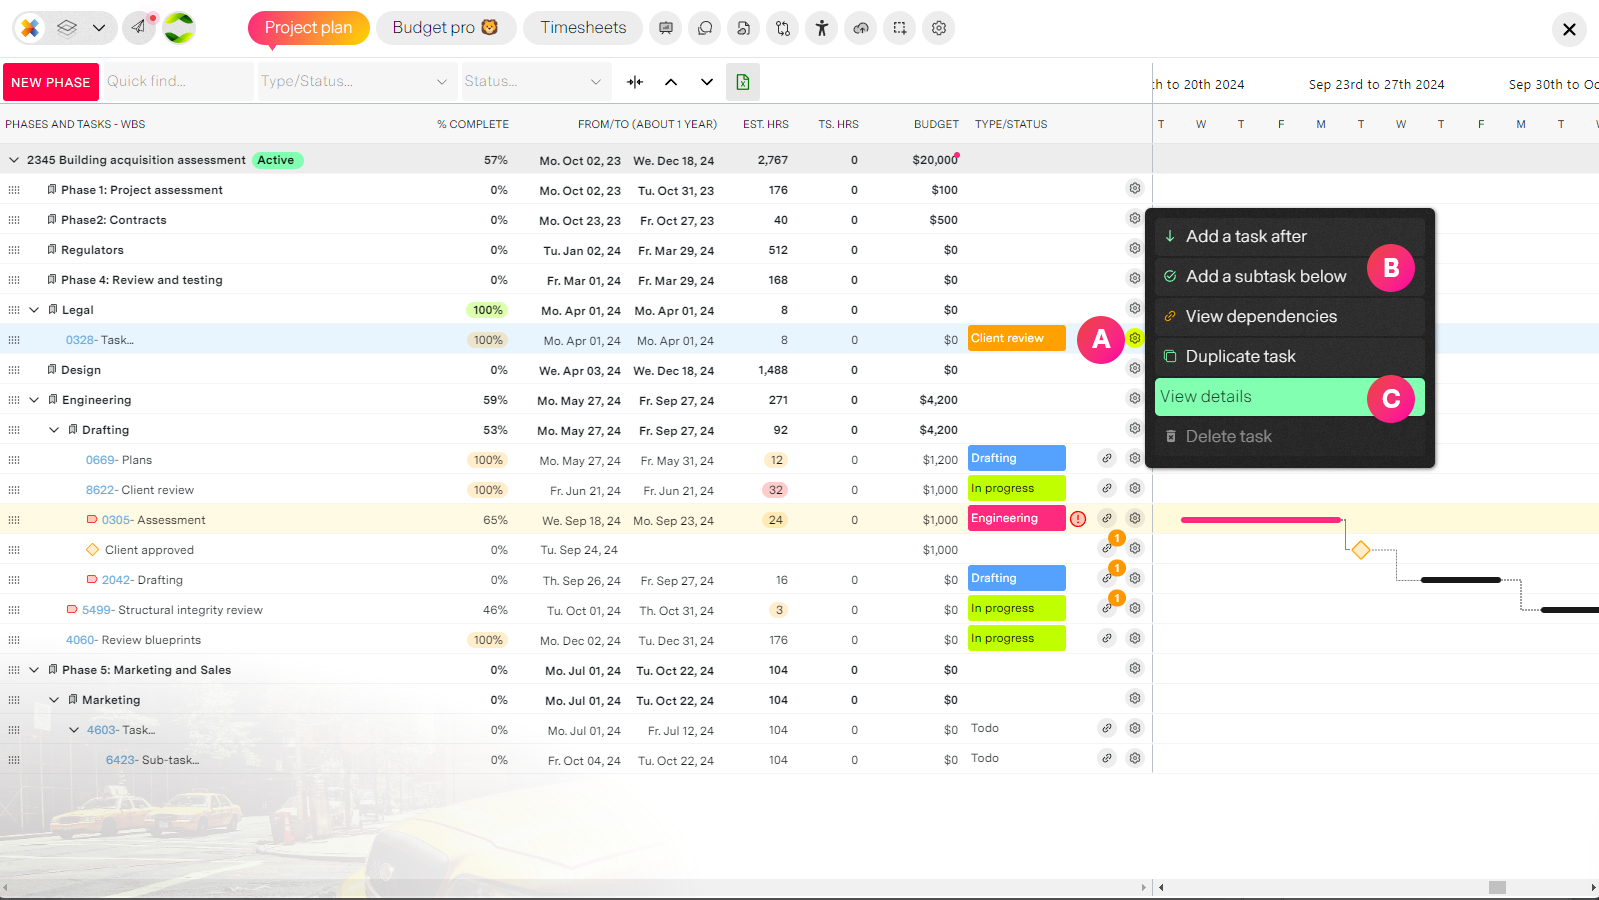
| Label | Feature | Description |
| A | Activity menu | Hover your mouse over the gear to access the activity menu No need to click, just mouse over the icon. |
| B | Options |
Important note: A sub-activity is a visual representation for showing and estimating work as groups. You can further break down each activity and sub-activity in the activity details to keep related work organized without cluttering your project plan. Milestones have a shorter menu: make or manage dependencies, add a dependent activity, add an activity below, compress dependents, and delete the milestone. |
Working with dates
For project managers
Dates are not so straightforward in Gantt charts. If you do not need to keep to firm timelines or estimate bottom up, you should be using another project type like Modern Kanban.
There are a lot of dependencies around dates. For example dependencies on other activities, the total of all activities for a package, and completed items. Let's take a look.
Planning mode and starting the project
Before a project is kicked off it sits in Planning mode. You build the whole WBS, sequence it and estimate it against provisional dates without anyone being held to them.
When the plan is ready, press Start the Project and choose the real start date. missionX shifts every package, activity and milestone relative to that date, preserving durations and skipping weekends, so the shape of your plan survives the move.
Tip: Right after kick off is the moment to create your first baseline. That is your PMI schedule and cost baseline, and everything you report later is measured against it.
Changing start and end dates
Selecting a date range only applies to activities and to packages with nothing under them.
Packages which have activities and/or sub-packages can only have their dates shifted, because their from/to dates are derived from the earliest and latest dates of all children rows. See the next part, "Shifting dates".
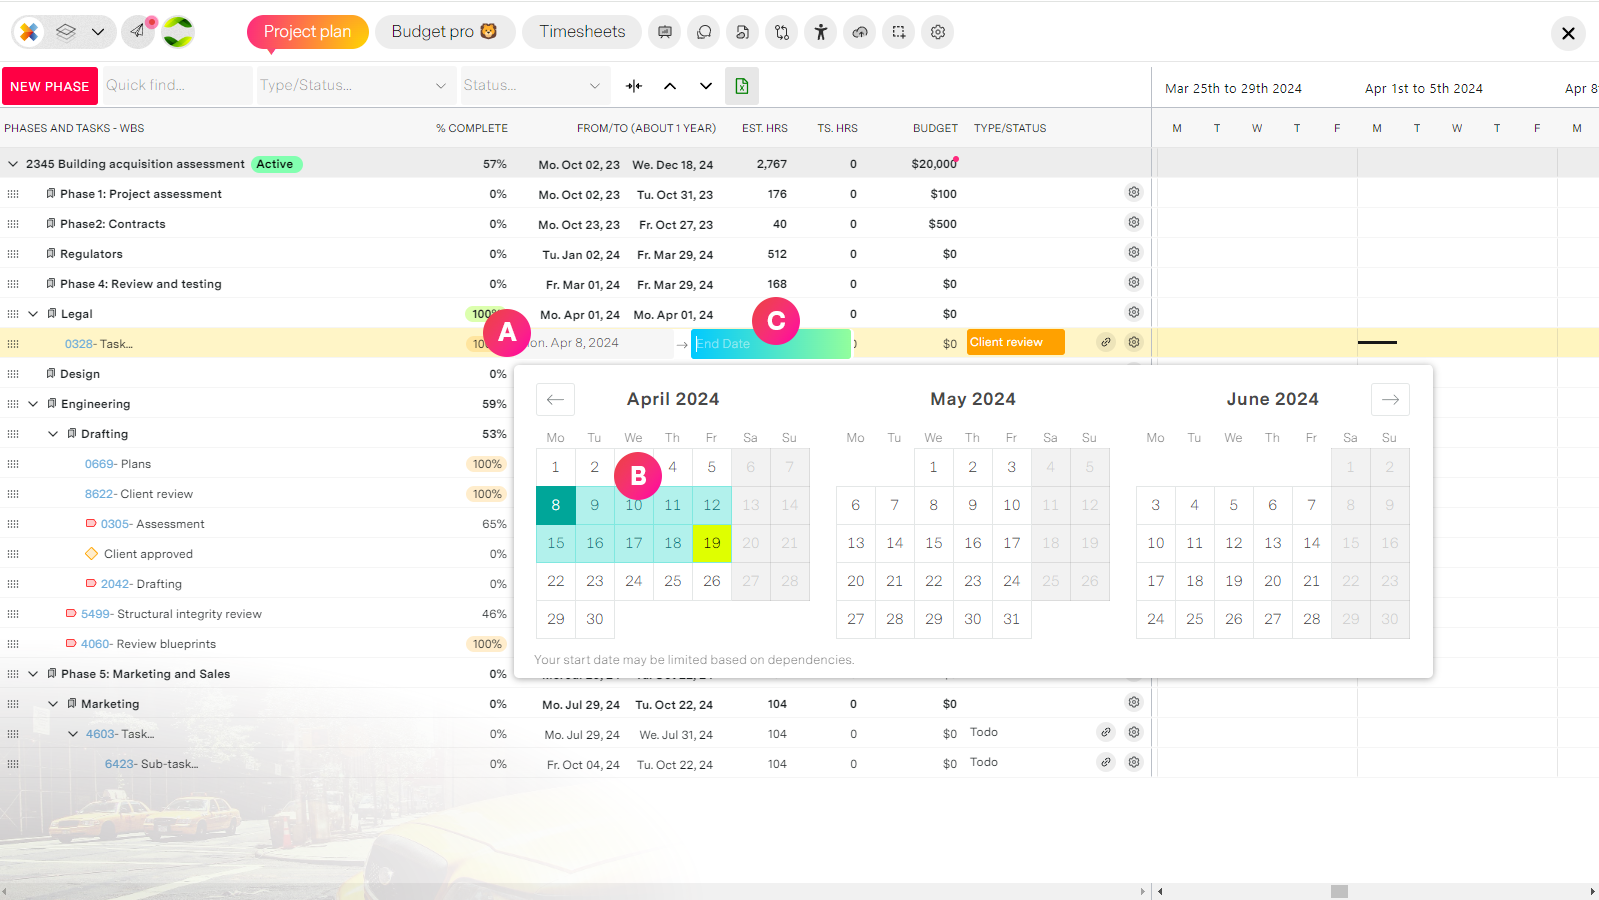
| Label | Feature | Description |
| A | Navigation | Pick the start and end of the row. Weekends are skipped automatically when missionX adjusts the dates. Please note: Budget pro and Timesheets are only available for Unlimited organization projects |
Shifting dates
When a package has children rows, packages or activities, then the package start and end date is by default the earliest and furthest end date of all packages and activities under it.
For project managers
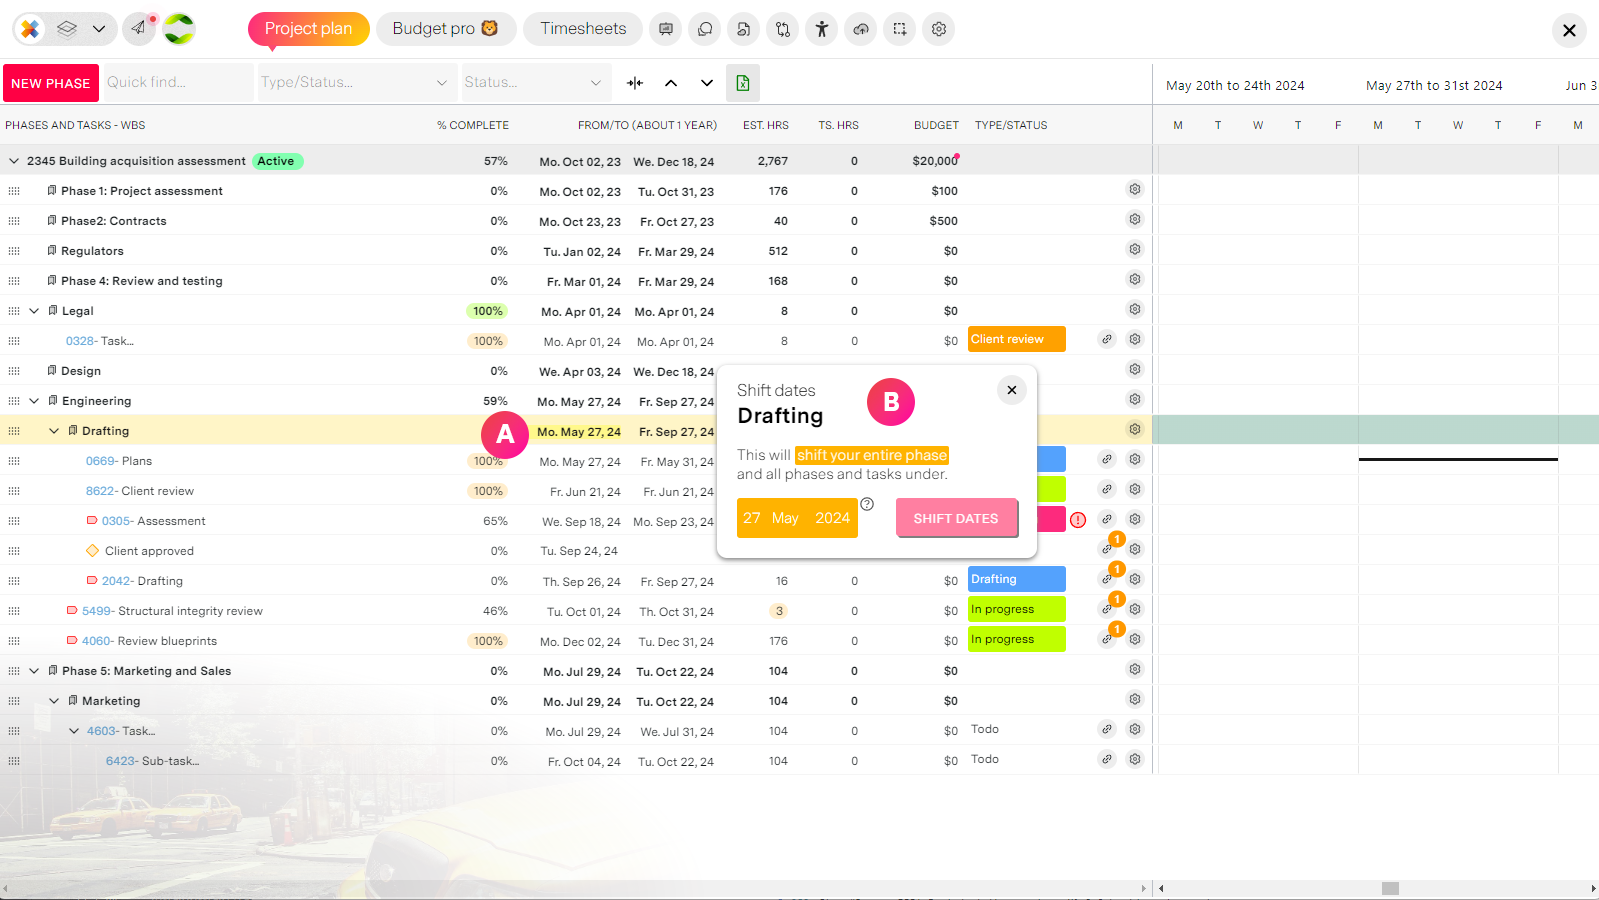
| Label | Feature | Description |
| A | Select a date | Click on any date of a package or sub-package to access the shift menu |
| B | Select a new date | Select the new date and press "Shift Dates". Once you confirm the change, the entire package and all rows under it will be shifted relative to the new date. Example: If you shift the package out by a week, all rows will also shift by a week. This way your plan is not changed, only shifted. |
Ordering your WBS
Rows are held in WBS order, not date order. Each package and activity has a position among its siblings, which is what drives the WBS code you see in the grid and in the WBS tab.
- Drag a row onto the top or bottom edge of another row to reorder it among its siblings.
- Drag it onto the middle of a package to nest it inside that package.
- Drop a row on the project summary row to bring it back to the root level.
- In the WBS tab, use the ← and → buttons on a node to move it among its siblings.
WBS codes renumber themselves the moment you reorder or re-nest, so the numbering always reflects the current structure.
Activity dependencies
Sometimes one activity cannot be started until another completes. For example, you cannot add the roof until the foundation is finished.
For project managers
Dependency types
From the activity gear menu choose Manage dependencies, pick a predecessor and then set the relationship. missionX supports the three relationships most projects actually need:
| Type | PMI name | Description |
| End to start | Finish-to-Start (FS) | The predecessor must complete before this activity can start. The default and by far the most common relationship. |
| Start to start | Start-to-Start (SS) | Both activities must start at the same time. Start-to-start relationships also accept a Lag time in days, so the successor can start a fixed number of days after the predecessor starts. |
| End to end | Finish-to-Finish (FF) | Both activities must finish at the same time. Not available when either side is a milestone, since milestones have no duration. |
Start-to-Finish (SF), the fourth PMI relationship, is deliberately not supported. It is vanishingly rare in real plans and a frequent source of scheduling errors.
The critical path
missionX runs the Critical Path Method across your dependency network and flags the activities that drive the project end date. Critical activities are marked with 🔥 in the grid so you can see instantly which slippage costs you the delivery date and which does not.
If you create a circular dependency, missionX detects the cycle and tells you which activities are involved so you can break it.
Dependency mode
For fast wiring of many links, use dependency mode rather than the panel.
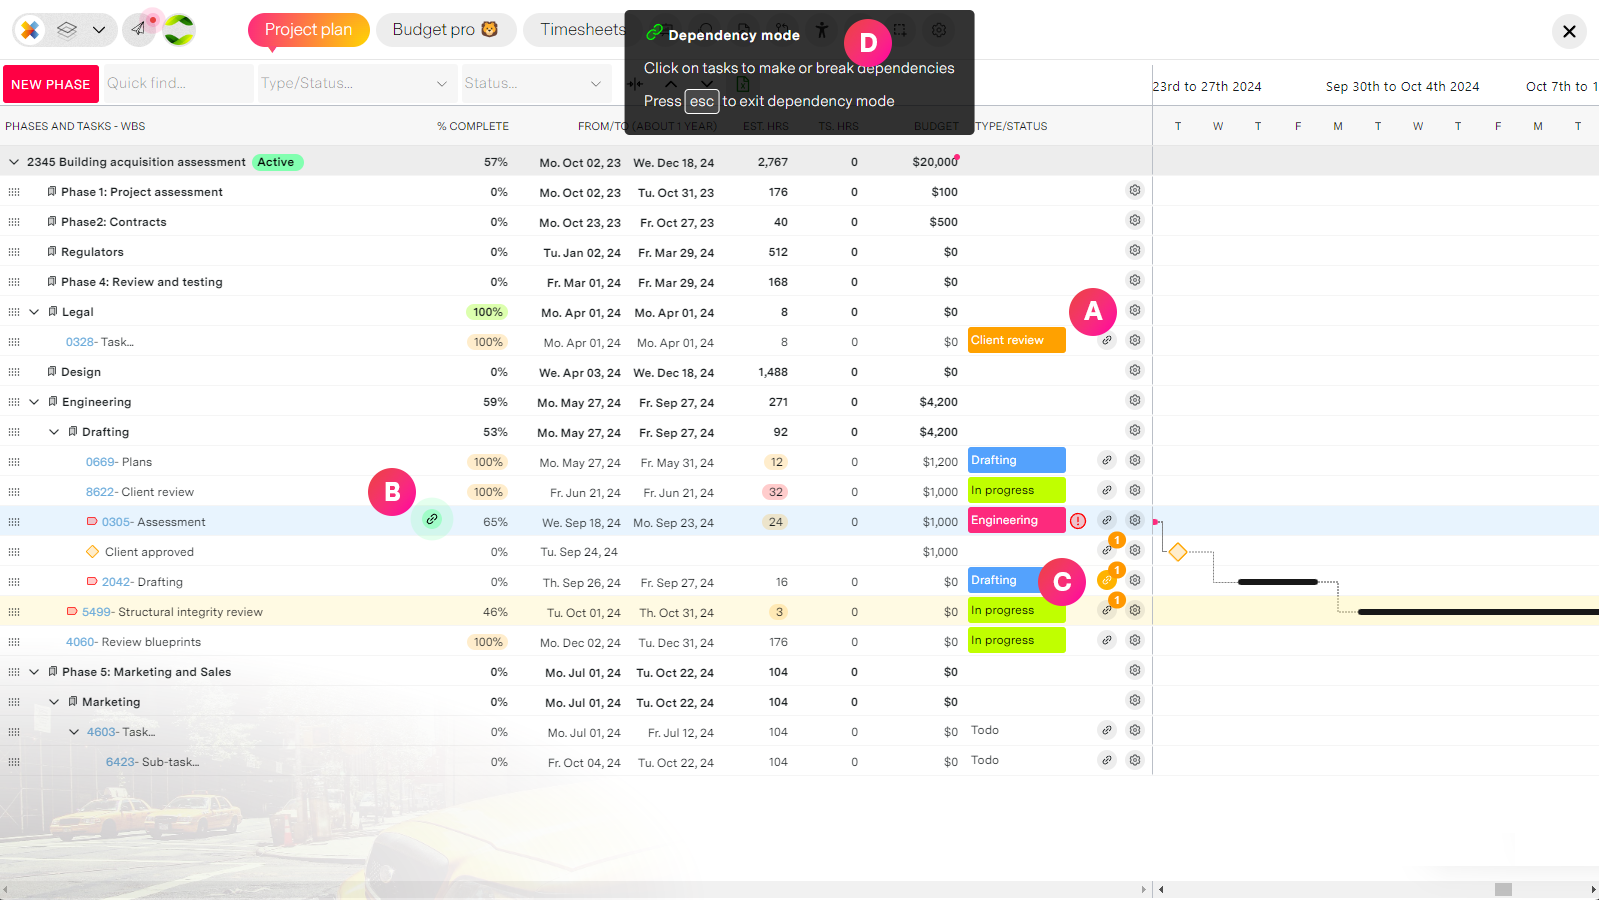
| Label | Feature | Description |
| A | Start dependency mode | Click on the link icon on the far left of each activity row to enter "Dependency mode" |
| B | Dependency mode | When in dependency mode your mouse pointer will now allow you to click on other activities to create or remove dependencies. As you mouse over rows, the icon following your mouse will change colors depending on the eligibility of the row under it. Red means not eligible for a dependency. Examples are clicking on the same activity, away from the rows, or on a package. Green means ok to make a dependency Orange indicates a dependency already exists and can be removed if clicked You can still filter and search while in dependency mode. |
| C | Dependency indicator | If an activity has dependencies the number of dependencies will be shown in the orange dot above the link icon While in dependency mode, all activities that are dependent on the active one will flash to signal a dependency already exists. |
| D | Exit dependency mode | You can cancel dependency mode by pressing the Escape (esc) key |
Resource view and RACI
The Resource view tab is your responsibility assignment matrix. Every role on the project is listed as a tree with the activities beneath it, along with the WBS code, number of activities, estimated hours and actual hours.
| Control | Feature | Description |
| View by RACI... | RACI filter | Show only the work where a role is Responsible, Accountable, Consulted or Informed. |
| Role selector | Add roles | Add roles directly here, or on activities using the RACI column in the timeline. RACI roles added to activities automatically appear here, and you can then assign people to them. |
| Quick find | Search | Filter the matrix across all columns. |
| Row click | Manage the person or the budget | Open the role to manage the assigned person and their rates, or open the activity budget editor. |
Work packages carry a RACI team too. Open a package from the WBS tab and set the Responsible, Accountable, Consulted and Informed members for the whole package.
Categorize work
For project managers
You can create a process flow and use it to track the status of an activity. Example: With client, In progress, Design, etc.
Making a linear process to follow and track task progression is easy when using the missionX flow maker. Each column represents a step in your process and has special features to help you automate tasks flowing through it.
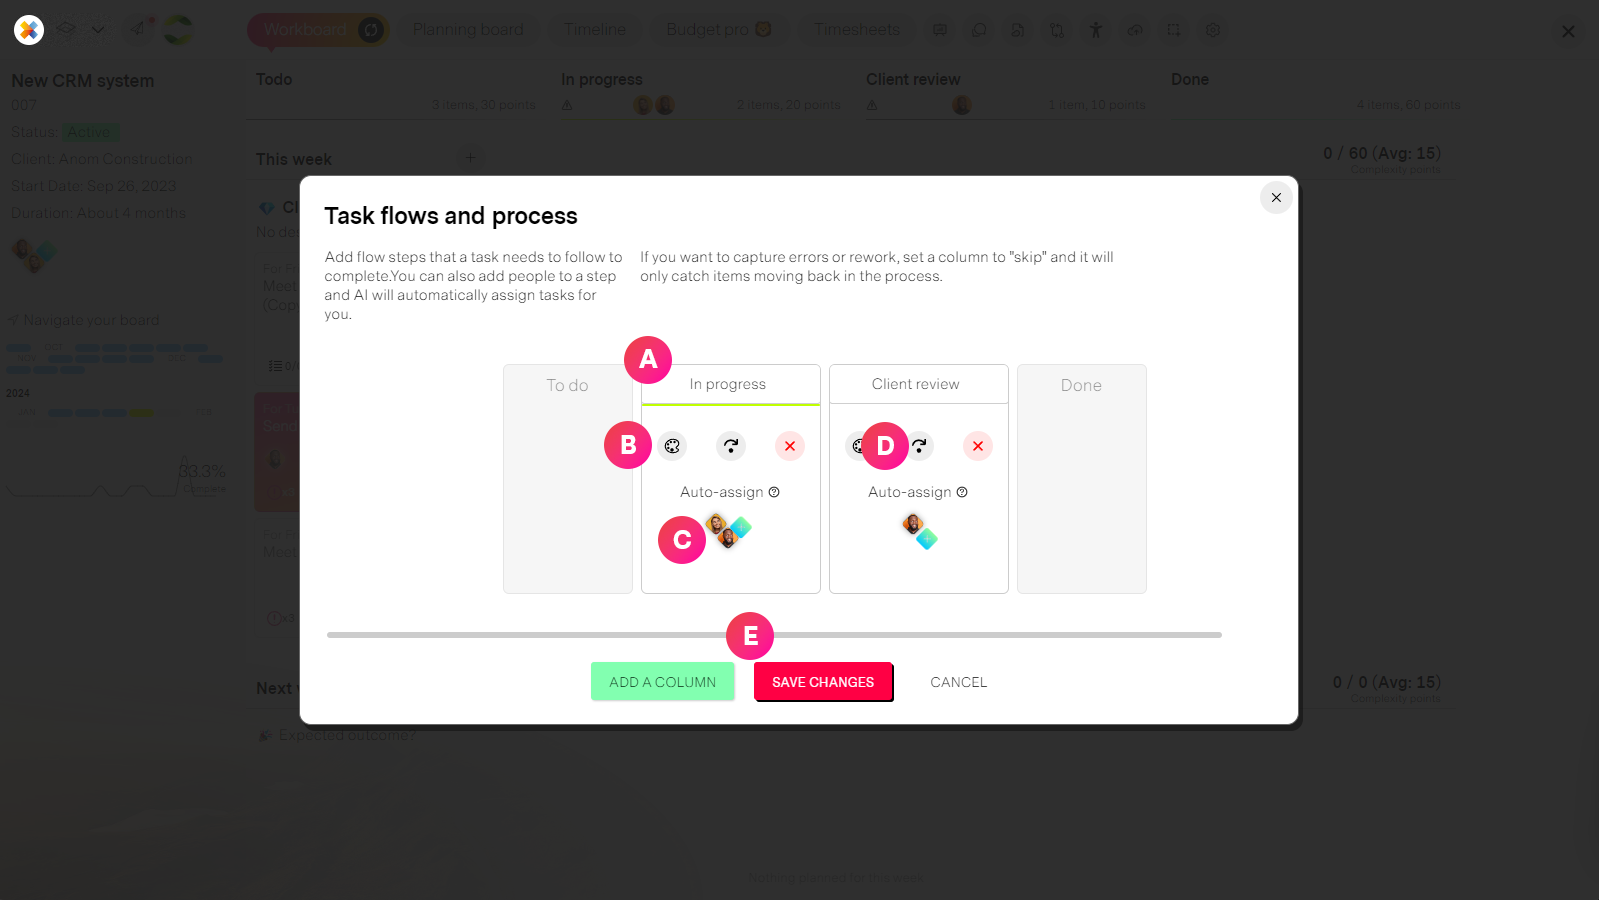
| Label | Feature | Description |
| A | Columns (Steps) | These are the steps of the process in the order your define. If you want to change the order, simply drag and drop to reorder. |
| B | Column controls | Optionally select a color for your colum to differntiate tasks on your workboard. Delete the column. If you delete a column, any tasks in the column will be automatically taken back to the previous step. |
| C | Auto-assign | If you choose to assign people to a column, then any tasks moved to this part of the process will be automatically be assigned to the person with the most capacity. An example of this would be if you have an "Approval" step, then the person who is in charge of approving work will automatically be assigne the task and notified. |
| D | Skip steps | In some cases you may want tasks to skip steps going forward in the process but allow for items sent back in the process. A common scenario for this is "rework" or "changes needed". An example might be if your process looks like: Design, Changes and Client approves. "Changes" would then skip and tasks would go directly for approval. If for some reason it is not approved then you can send it back to "Design" This is extremly helpful if you want to spot problems or track how much volume is being sent back in the process by looking at the colum header's details. |
| E | Flow controls | Add a a new column from here and save any changes before exiting. Please remember to save your changes. This is one of the few places where missionX does not autosave for you. |
Estimate costs
For project managers
When we say costs we actually mean what it will cost the customer or client. Budgeting therefore is only available if this is a client and billable project.
Budgeting can be done at the work package or activity level.
If you add a cost to a package then activity estimates will be ignored, but if you estimate at the activity level then estimates are rolled up and aggregated to the package.
The same applies to your project's top-of-the-house row. If you add an overall project budget then that is what you will see. If you do not, the project budget will be calculated from all package and activity estimates.
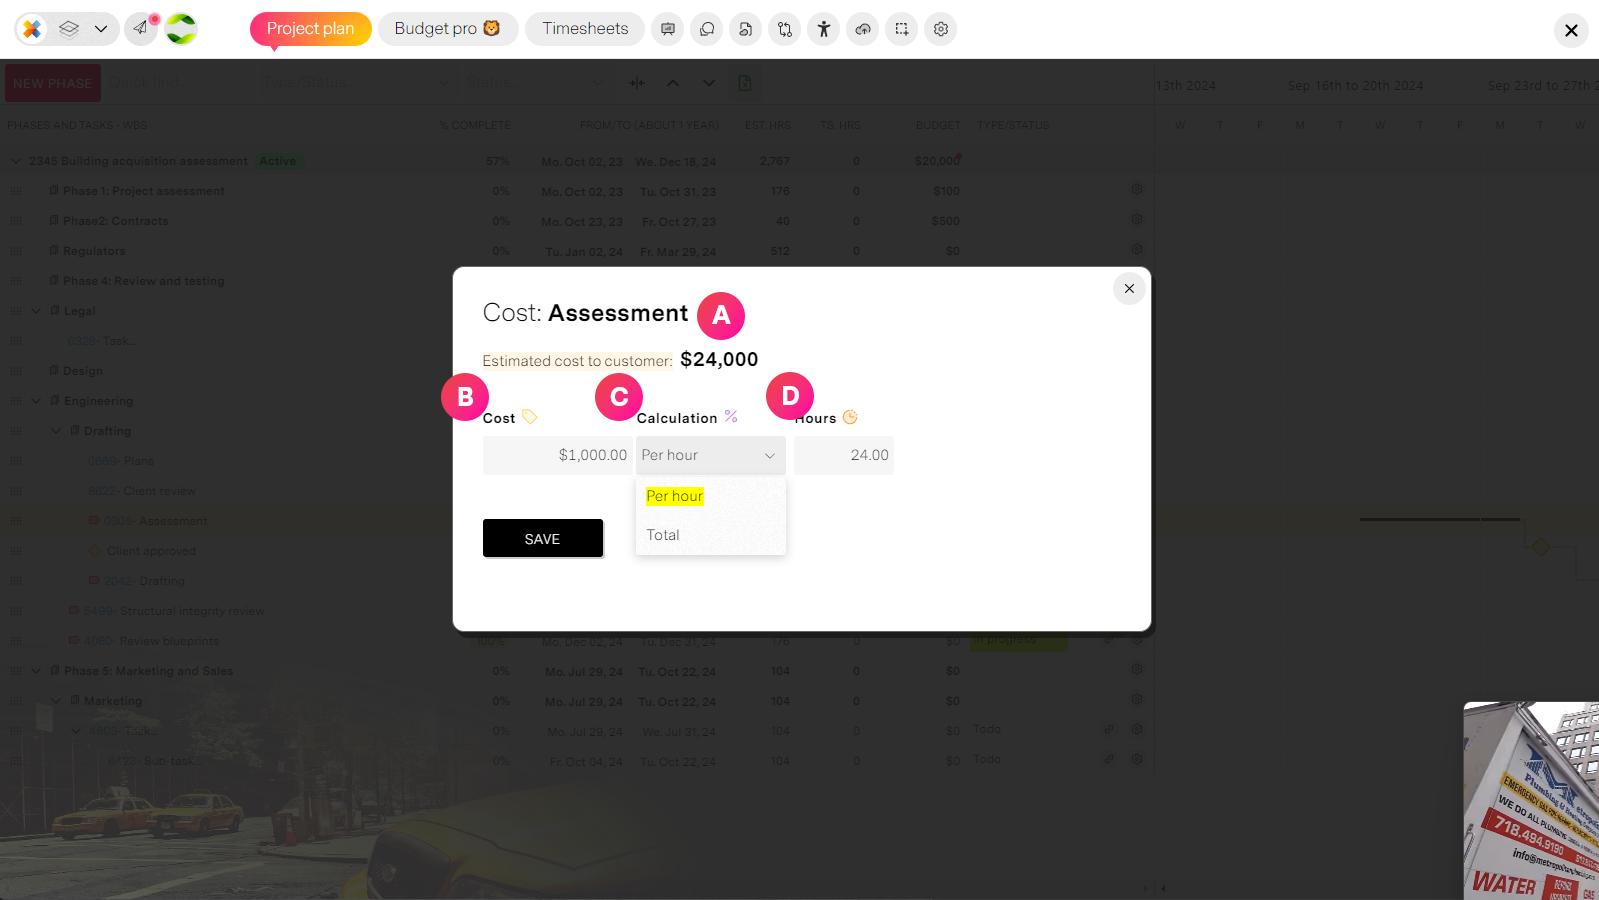
| Label | Feature | Description |
| A | Estimation panel | Estimate your activity and package costs or overall budget at the project level. Please note that costs are what you plan on charging a customer for and not an internal cost. If you need to estimate internal costs please use Line-items in Budget pro |
| B | Cost amount | Enter a number amount to be used in the calculation |
| C | Cost calculation | How is this being estimated? Per hour or as a fixed cost item. If per hour then missionX will always multiply the number of estimated hours by your amount. Fixed will never change unless you do so manually. |
| D | Estimated hours | By default missionX uses the estimated hours from your project plan but you can choose to override these and set them manually. |
Baselines
A baseline is the approved version of your schedule and budget, and in PMI terms it is what performance is measured against for the rest of the project.
Create one from the Baselines icon in the project tab bar, then come back to the timeline, open Columns... and select the baseline you want to compare against. The grid adds:
- BL-Start the baselined start date of the row
- BL-End date the baselined end date
- BL-Hrs the baselined estimated hours
Sit those next to the live dates and hours and schedule drift becomes obvious at a glance. Full details in Baselining a project.
Project report
All reporting in missionX is automated so there is no need to create any reports, just focus on your team and customer. But if you ever need to provide a print-friendly report you can do that with one click from your project's tabs at the top of the workspace.
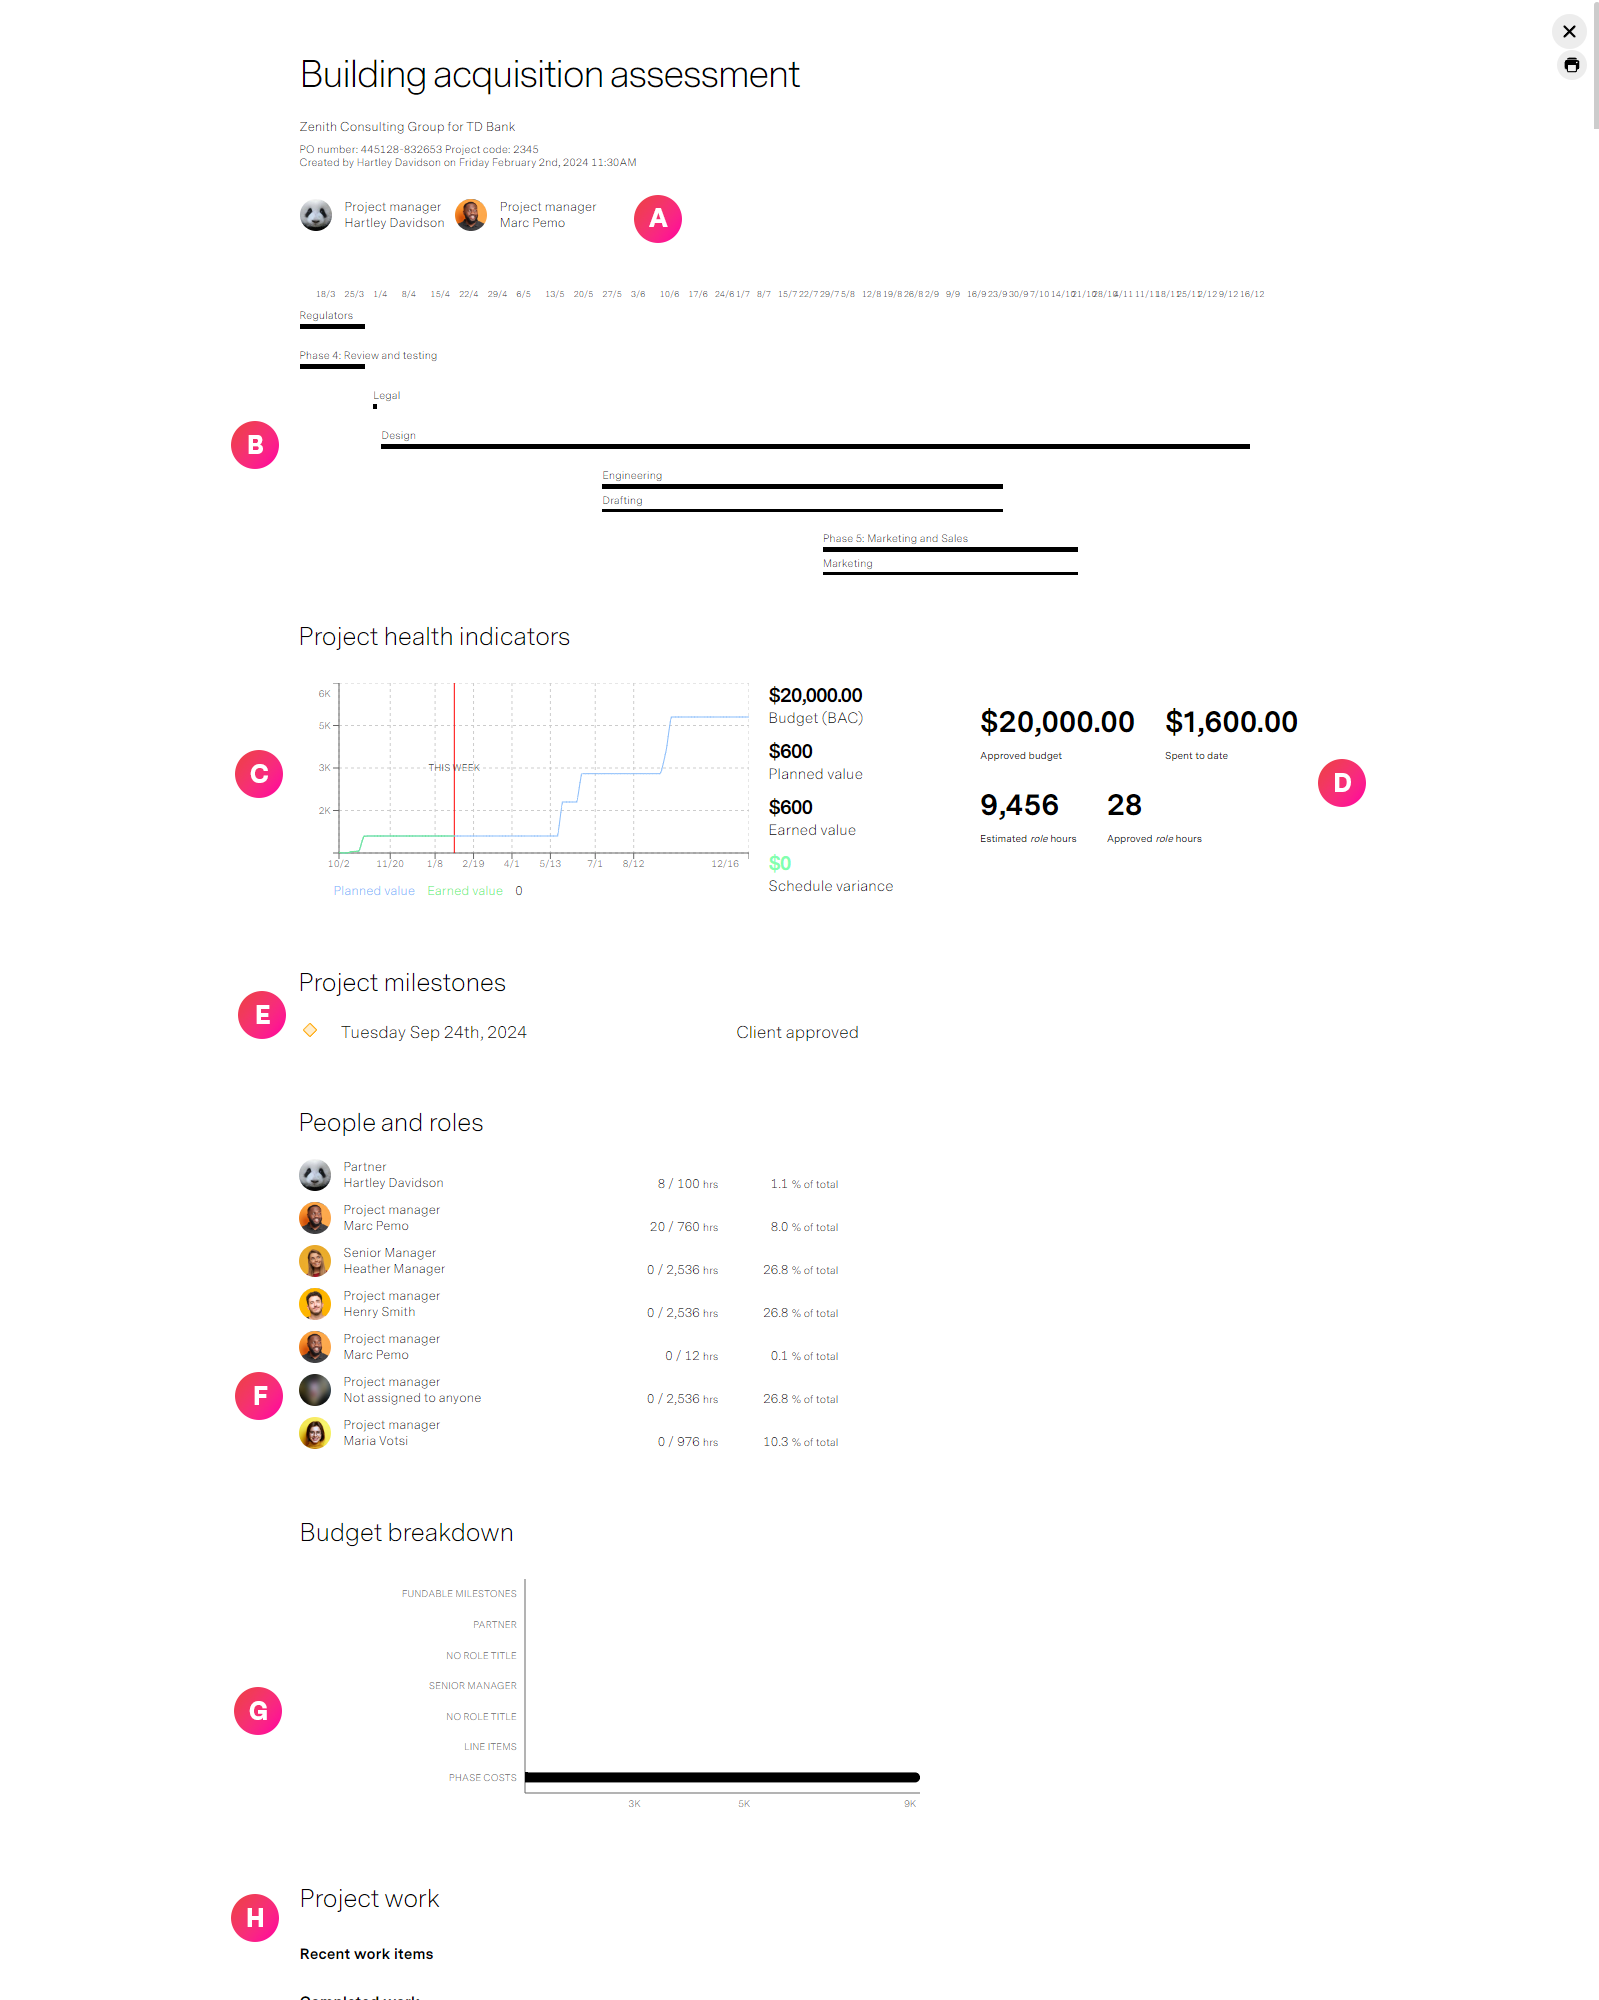
| Label | Feature | Description |
| A | Project details | Information about your project including project managers. |
| B | Project timeline | Your work packages are shown as a timeline. |
| C | Earned Value (EVM) | missionX automatically calculates and displays your Earned Value metrics as long as you keep your plan's planned revenue and percent complete of all activities up to date. |
| D | Key metrics | Compare approved/estimated hours and budget to actuals so you can predict delays or cost overruns. |
| E | Milestones | A summary of all project milestones along with dates and description. |
| F | People and roles | A view of all the roles that are active on the project and compare estimated/approved hours vs actual. Roles are added to the project to calculate cost and bill rates. Example: Designer, Engineer, Senior Manager etc. Unfilled roles will also be shown here |
| G | Budget breakdown | A summary of how project budget is allocated, including your activity and package estimates and items from Budget pro like line-items, fundable milestones, role costs etc. In most cases, if you are estimating at the package/activity level it will show most of the budget allocated as packages. |
| H | Activity status | A list of current and upcoming items being worked on. |
Earned Value Management
Automated EVM reporting using MX-Gantt. Manage your project's WBS and budget from MX-Gantt and missionX automatically generates real-time EVM reports.
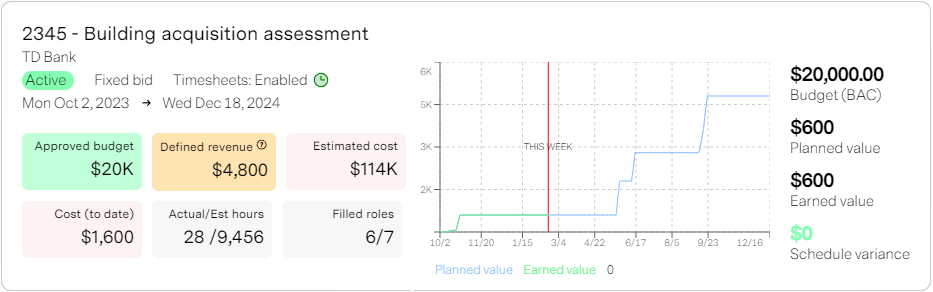
Intoduction to EVM
Earned Value Management (EVM) is a project management technique used to assess project performance and progress in a comprehensive manner.
It combines measurements related to the project management triangle:
scope, time, and costs.
How it works
If this starts to get too technical, don't worry you just track budget and % complete and missionX will do the rest.
- Planned Value (PV) or Budgeted Cost of Work Scheduled (BCWS) This represents the valuation of planned work. It's essentially the budgeted cost for the work scheduled to be completed at a specific point in time.
- Earned Value (EV) or Budgeted Cost of Work Performed (BCWP): These metrics quantify the actual accomplishment of work. EV reflects the value of work completed up to a given date.
- Actual Cost (AC) or Actual Cost of Work Performed (ACWP) This represents the actual cost incurred for the work performed.
- Cumulative Costs vs. Time Plot: EVM often involves plotting cumulative costs against time. This helps visualize both early and late curves, providing insights into project performance.
Benefits of EVM
EVM allows project managers to make accurate forecasts of potential performance issues. It's particularly useful for large or complex projects, where quantitative forecasts associated with earned value management play a crucial role.
By analyzing PV, EV, and AC, project managers can proactively address deviations from the planned project trajectory. In simpler terms, EVM helps answer questions like:
- Are we on track with our budget and schedule?
- How much work have we actually completed compared to what we planned?
- What are the cost and schedule variances?
Drawbacks of EVM
The biggest issue most people will say, is the complexity and intricacy that comes with using and maintaing specialized software and the overal approach.
missionX actually makes this a mute point by abstracting ALL the complexity involved... but one big drawback in our humble opionion remains.
EVM requires a lot of oversight and constant, meticulous updates to the project plan and budget. Progress and dates must always be up-to-date and as we very well know, to nail down a perfect timeline is like trying to swim in quicksand.
If you are commited to a very well defined plan and are willing to maintain it on a daily basis then missionX will make the rest effortless.
Viewing EVM reports
There are three ways to access your EVM reports.
1. From the Project manager's workspace Mission.Vision.Board > PM Power View
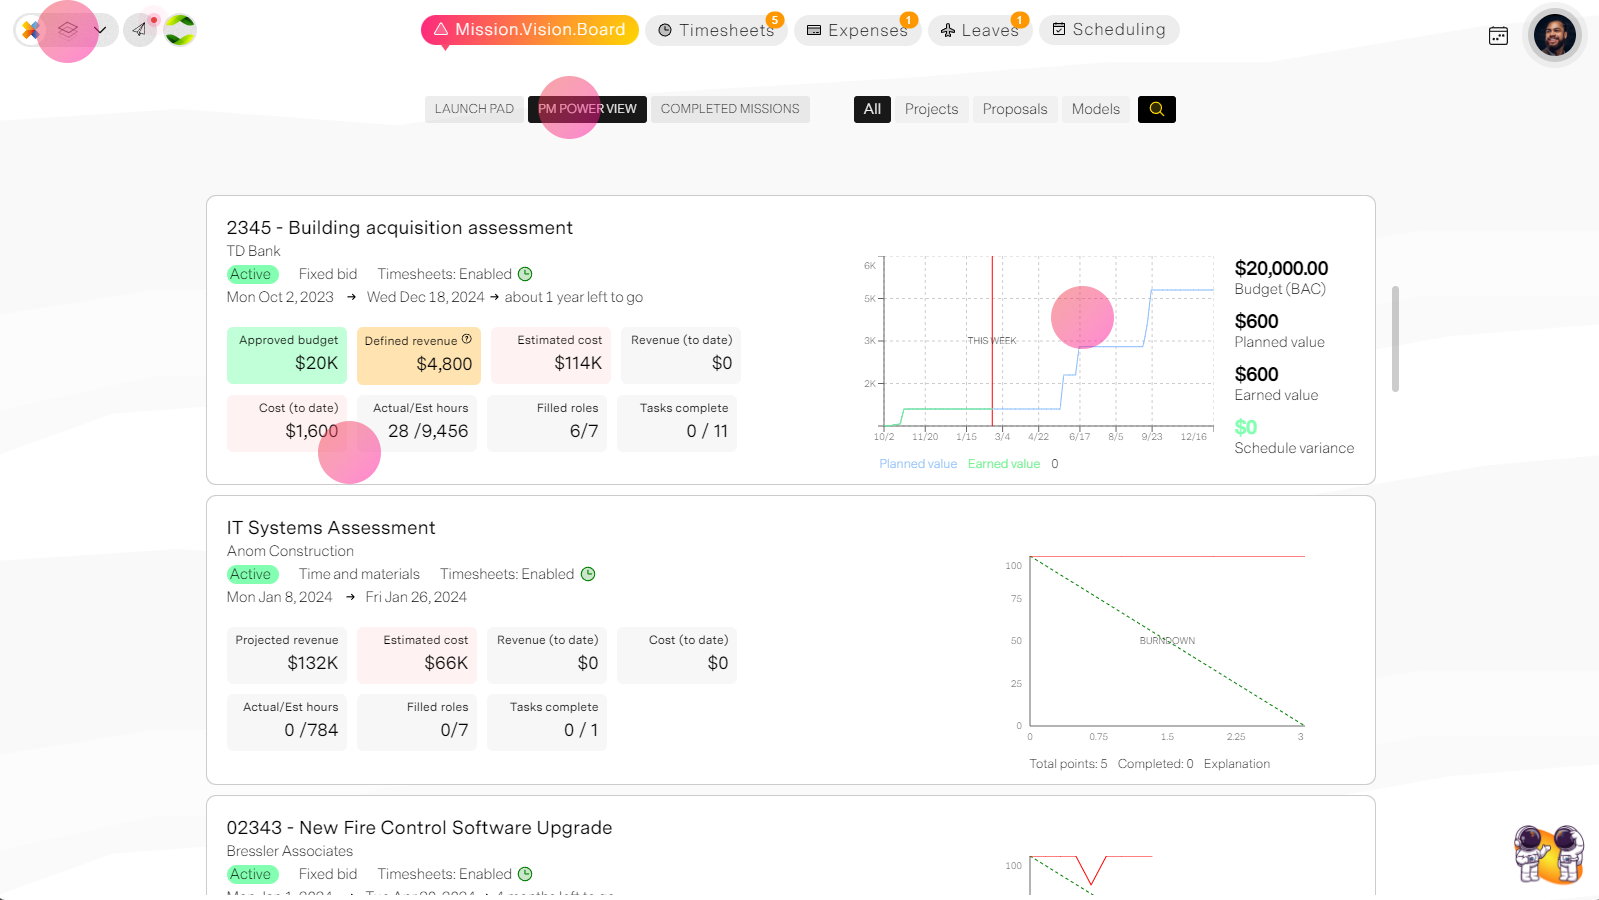
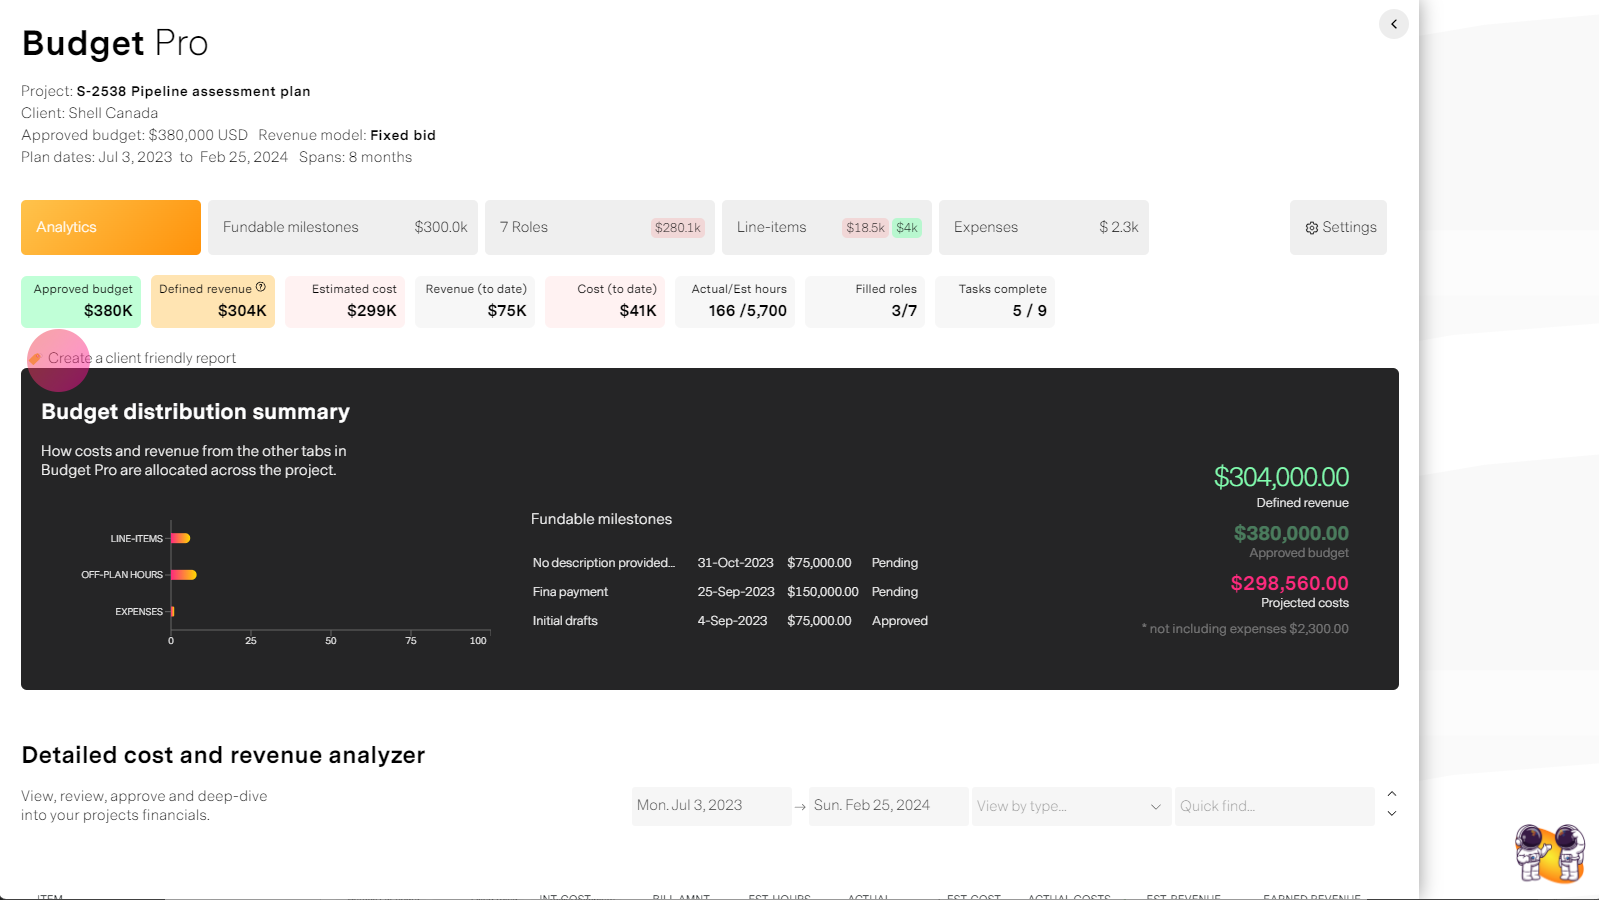
Through the project workspace or the organization Financials tab by opening Budget pro and selecting "Client friendly report."
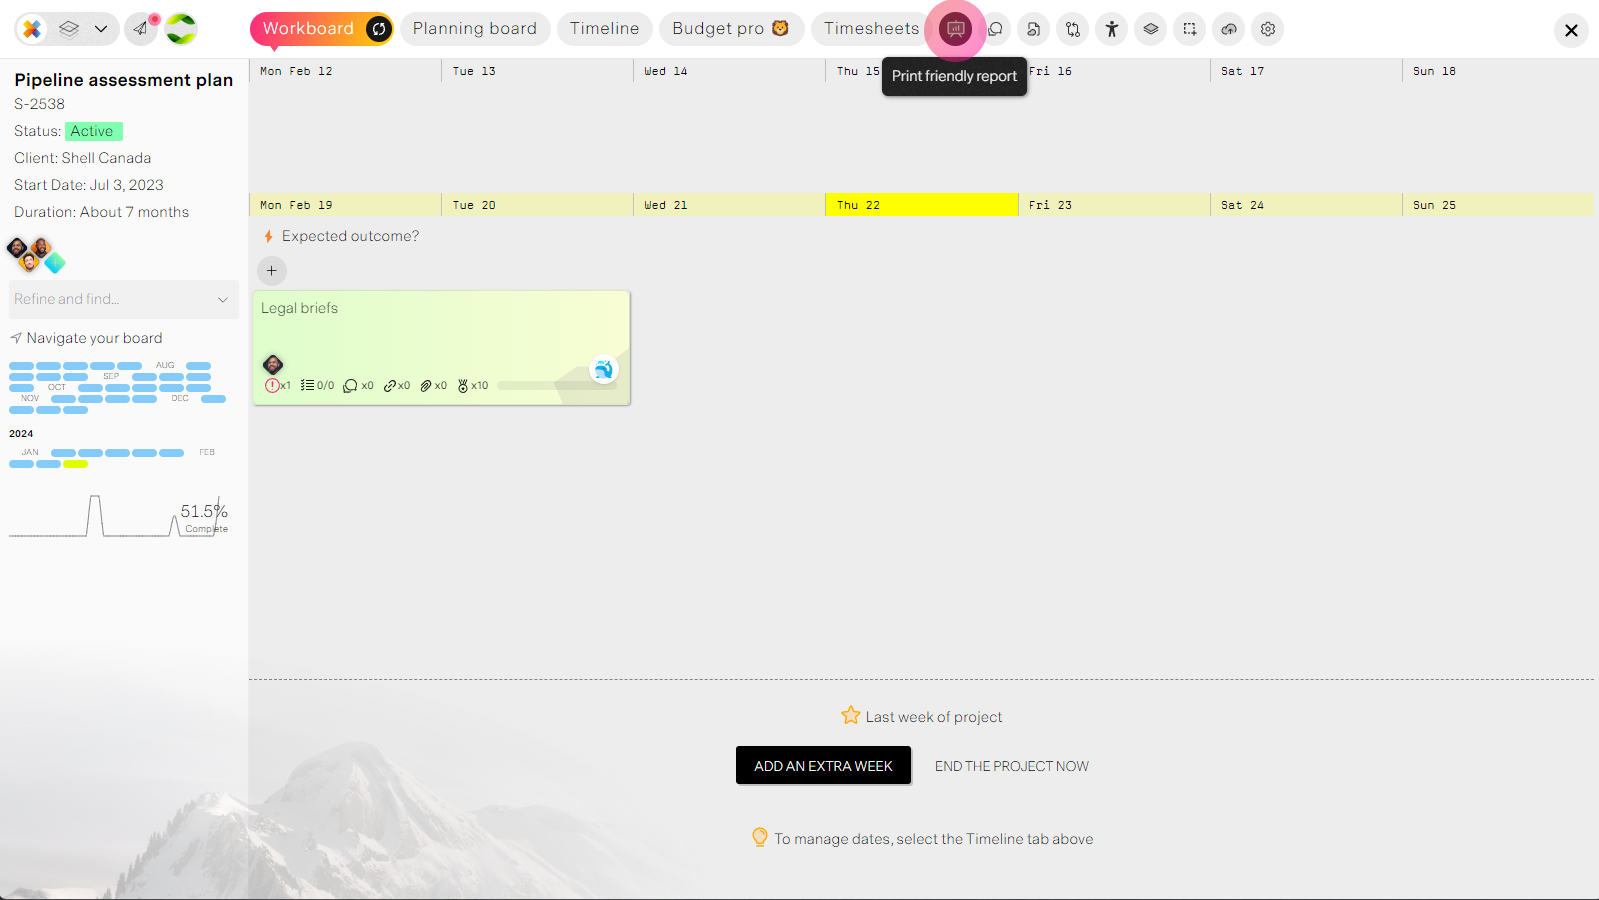
From the project workspace select the reports tab where you can see and print to PDF.
Summary
MX-Gantt is a powerful and sophisticated tool in your management arsenal and it follows PMI norms end to end: charter and stakeholders, a decomposed WBS of work packages, activities sequenced with Finish-to-Start, Start-to-Start and Finish-to-Finish relationships, a critical path, a RACI matrix, baselines and earned value.
This requires a lot of discipline from the project manager to maintain the plan and stick to schedules, but it does free the project manager from reporting, and aligns budget, timesheets and progress automatically.