
 Launch
Simple Agile
The simplest project type you could use. Just add tasks to your week by dragging, dropping and resizing to create a mini project plan for your week.
Advantages of Simple Agile
- View your project plan as a weekly calendar
- Quickly see the progression of all your tasks
- Resize tasks to set duration and drag and drop to change start and end dates
- Plan your work as Gantt charts but in mini, weekly increments making you more Agile
- You can toggle between Kanban and Simple workspaces
- Weekly planning with incremental goals to reduce risk
Tour the Simple Agile workspace
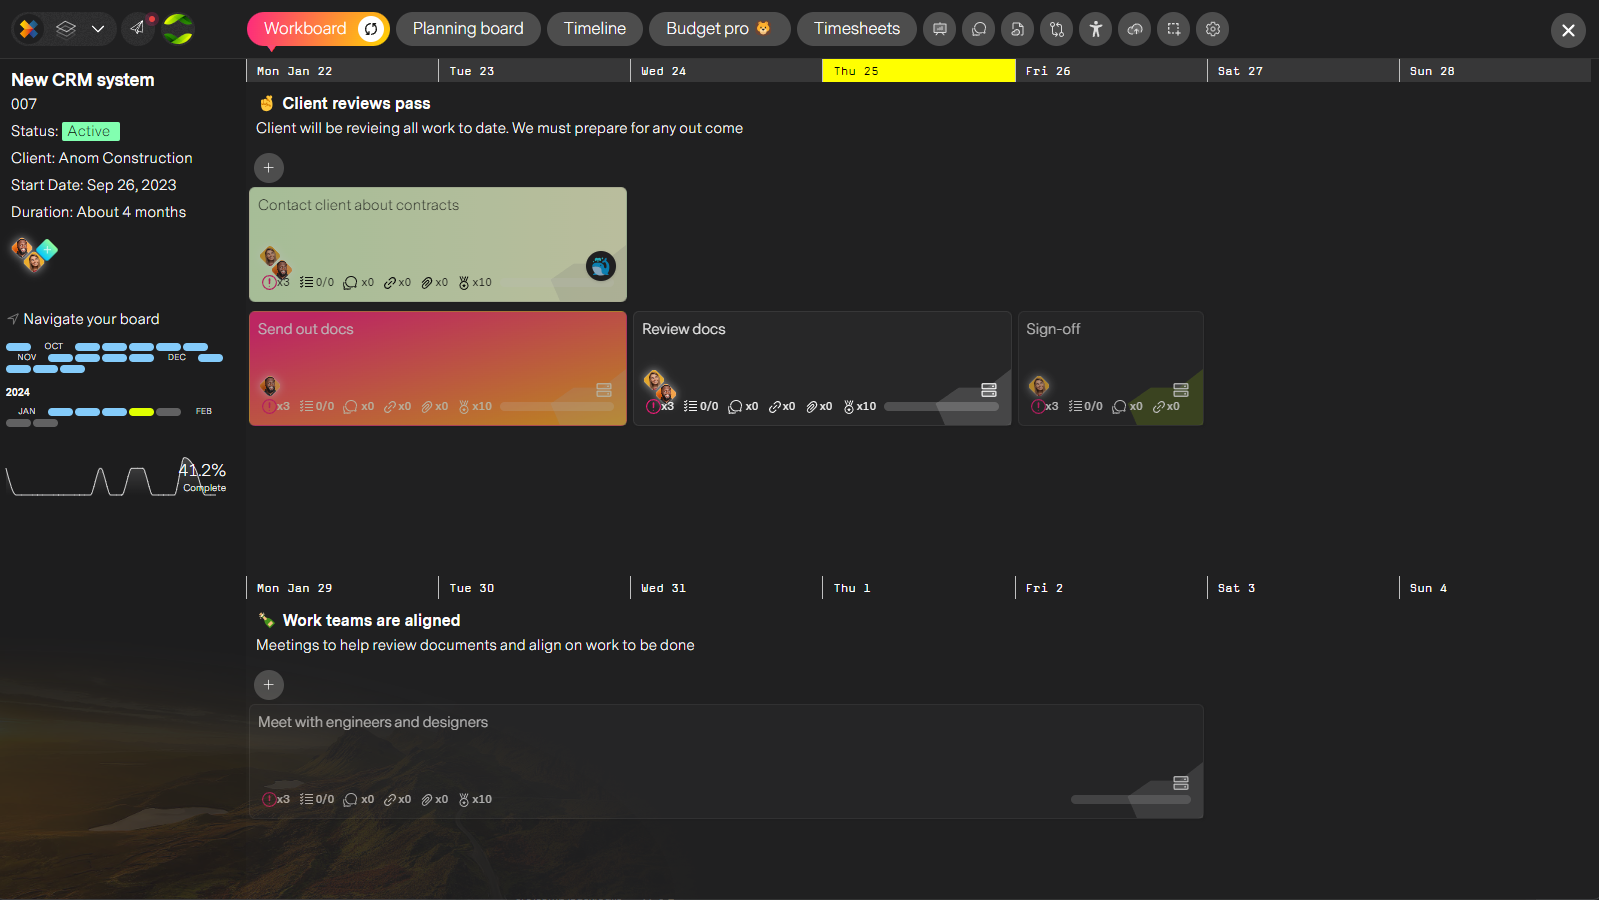
Shown in both Dark and Light modes. Both are supported, you decide.
Tip: Click on an image to zoom.
- The Workboard
- The Planning Board
- Project Timeline
- Budget Pro
- Timesheets Pro
- Project Report
- Comments/Discussions
- mission DOCS
- Process Flow Maker
- Manage the project team
The Workboard
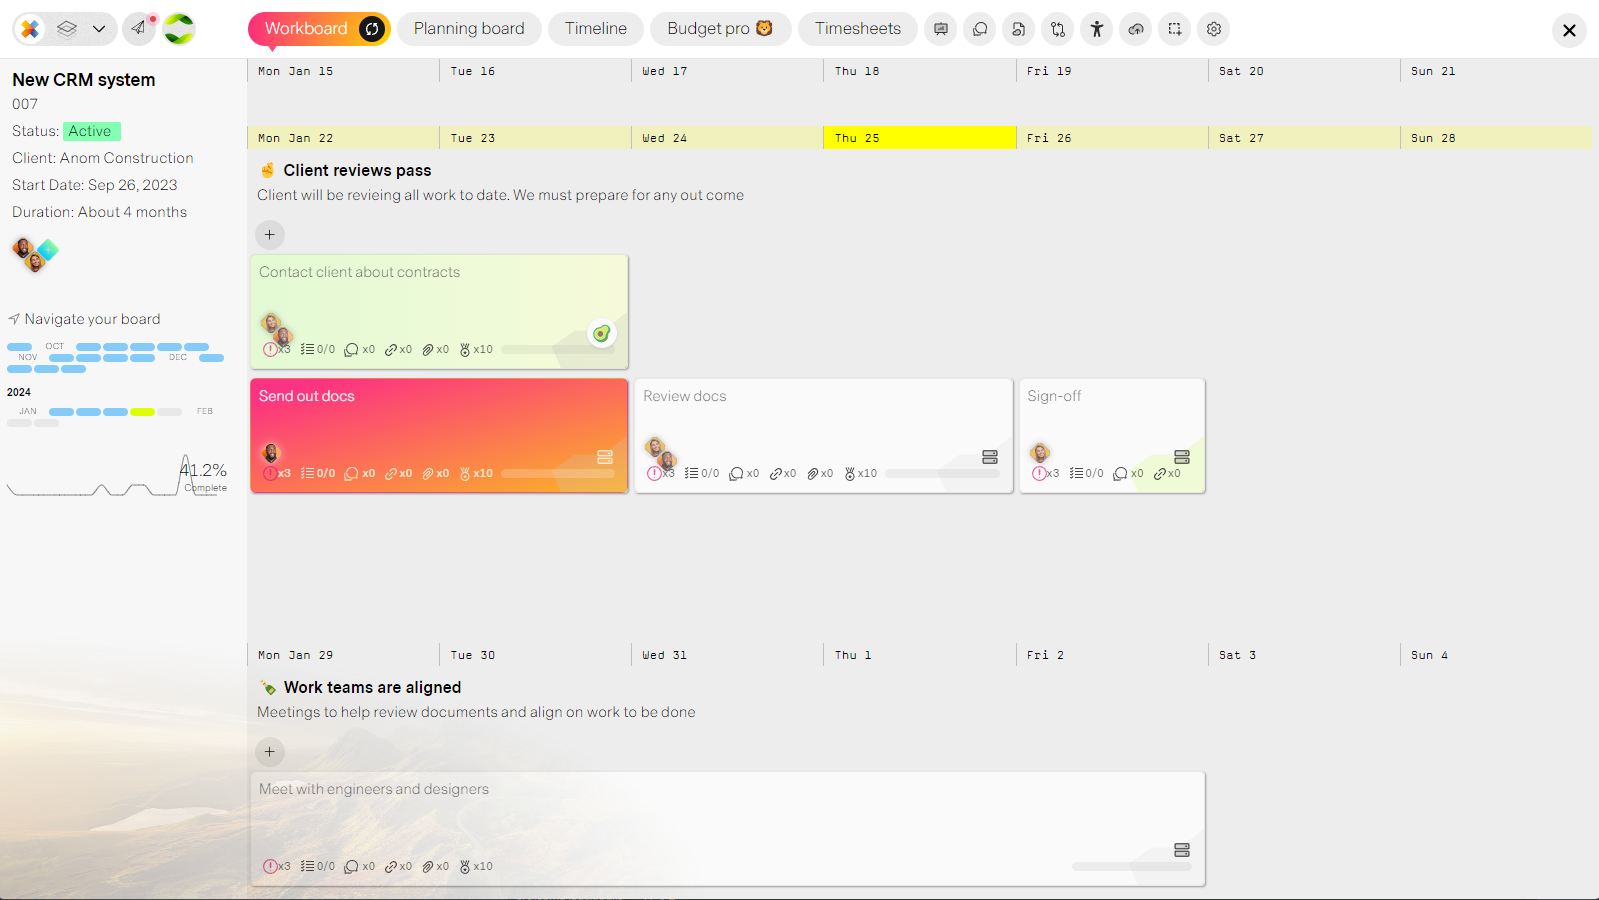
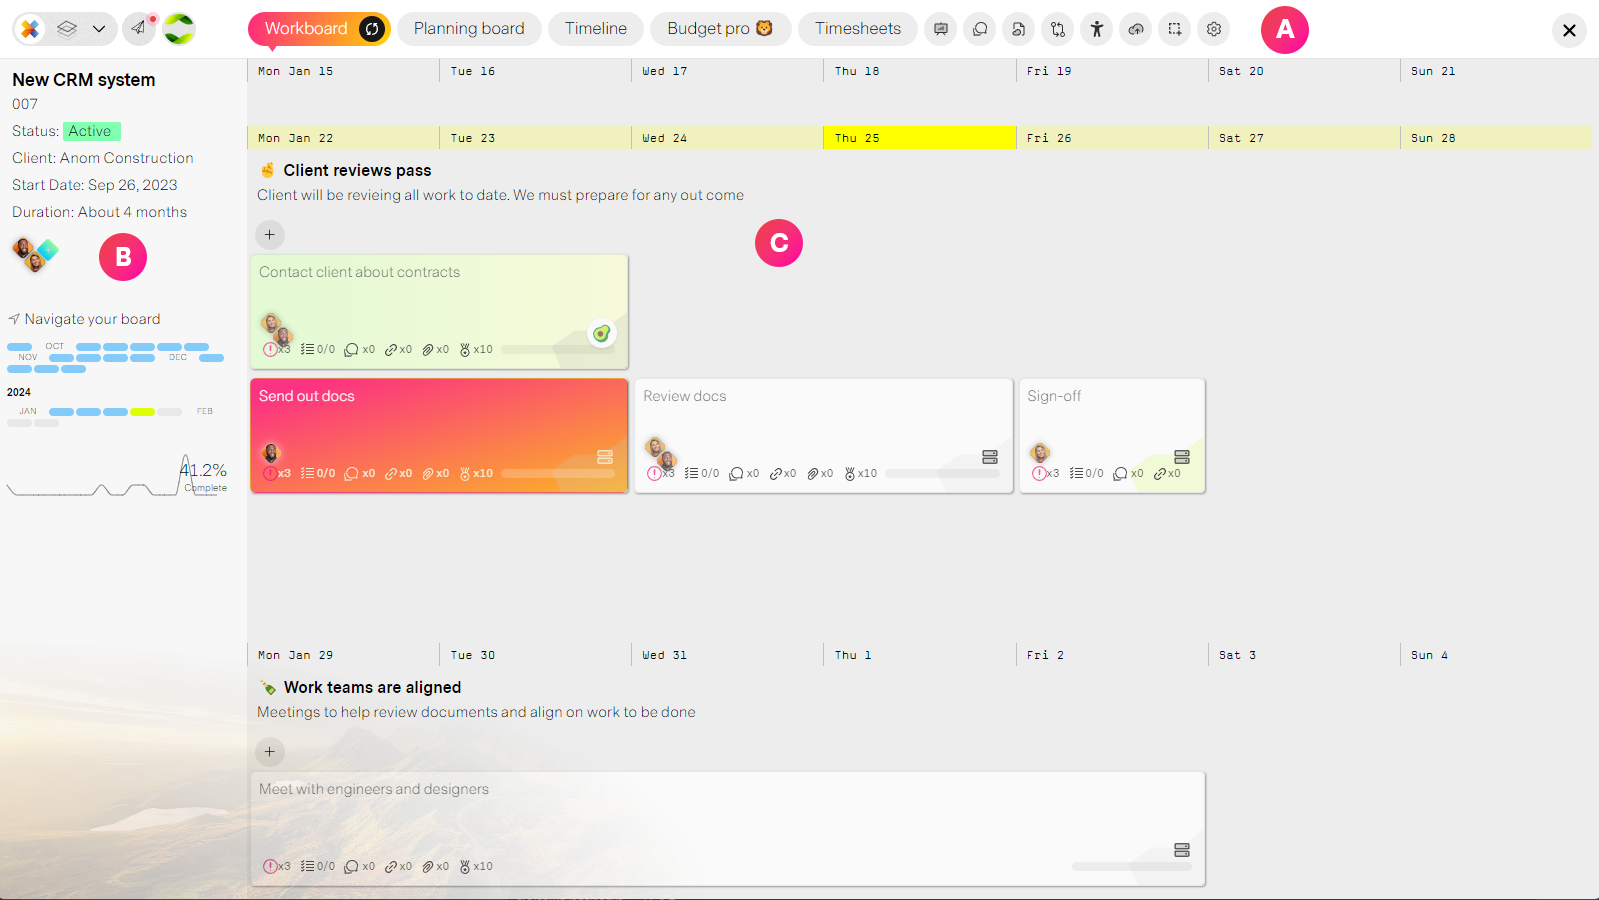
Here is where all the weekly planning happens. On the left you have project insights, across the top is your workspace navigation and in the middle you have your workboard with tasks organized on your weekly calendar.
The Planning Board
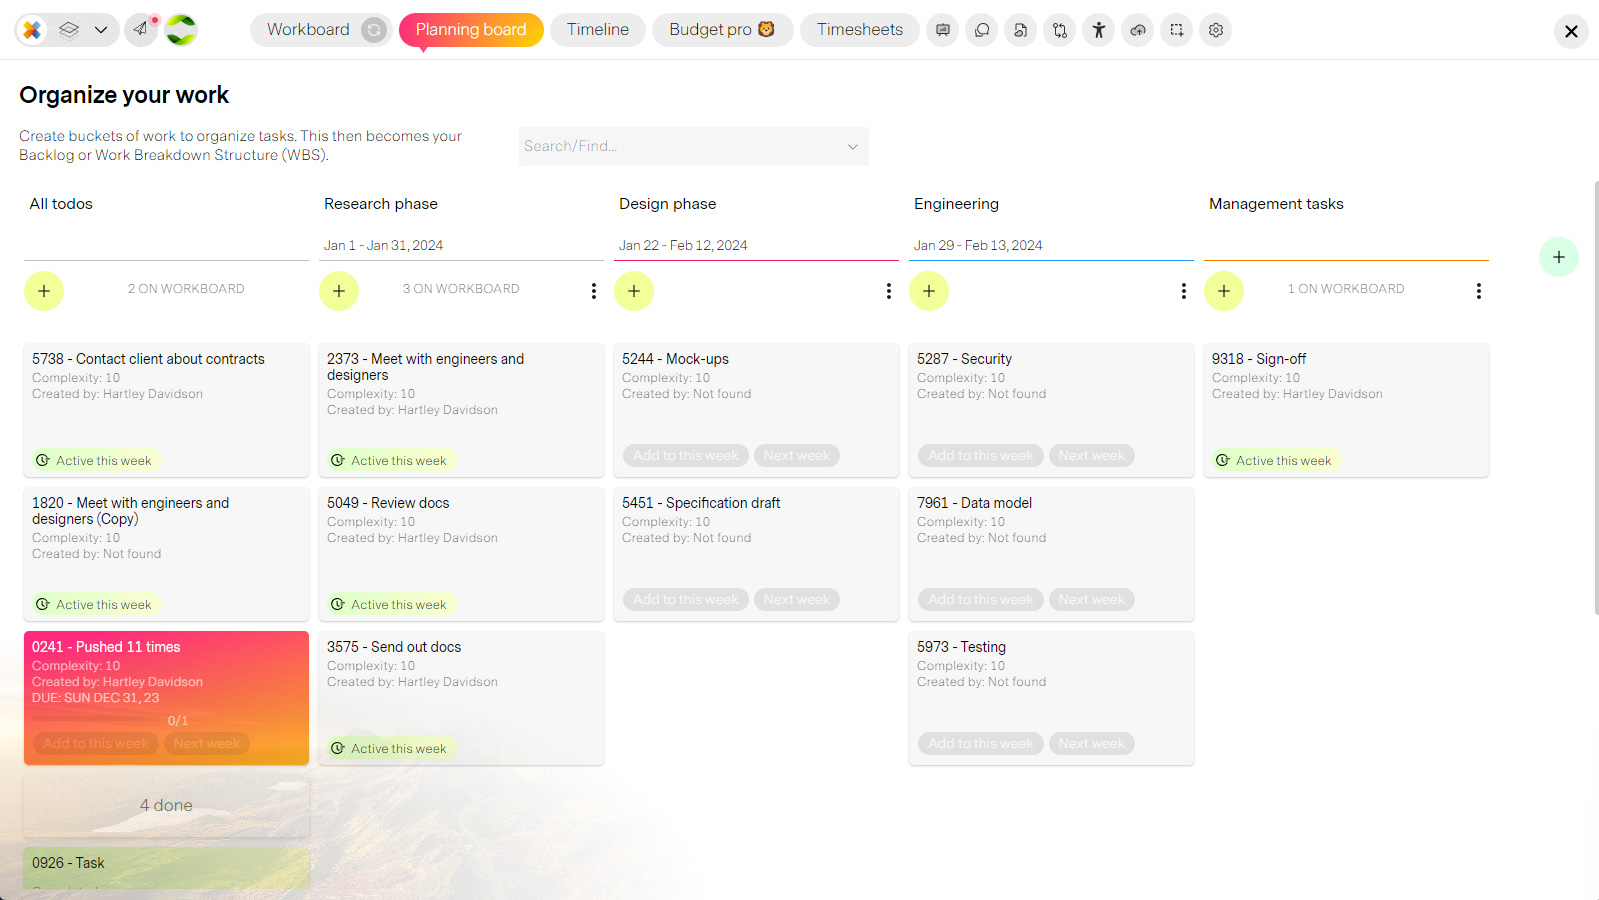
Think before you do. Organize your tasks into phases or "buckets of work". Here you define what needs to get done (WBS/Backlog), and your Kanban board defines when it will get done. Move tasks from your Planning board to your Workboard to schedule them.
Project Timeline
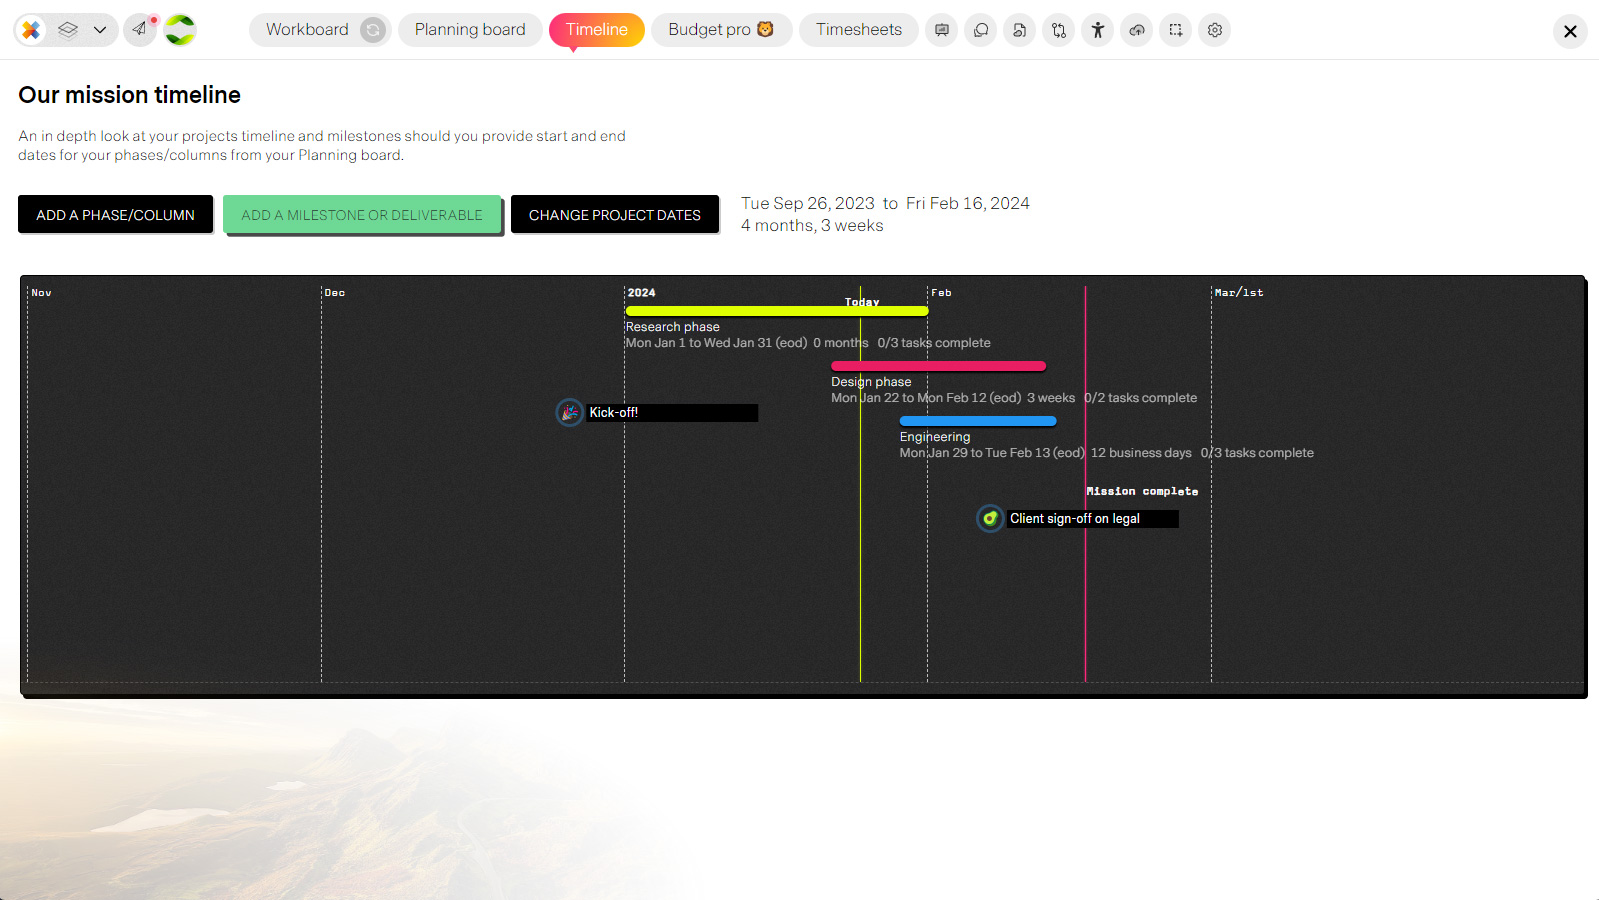
Drag, drop and resize to adjust dates for your project, milestones and phases. If you are being pure Agile no need to add dates to your phases.
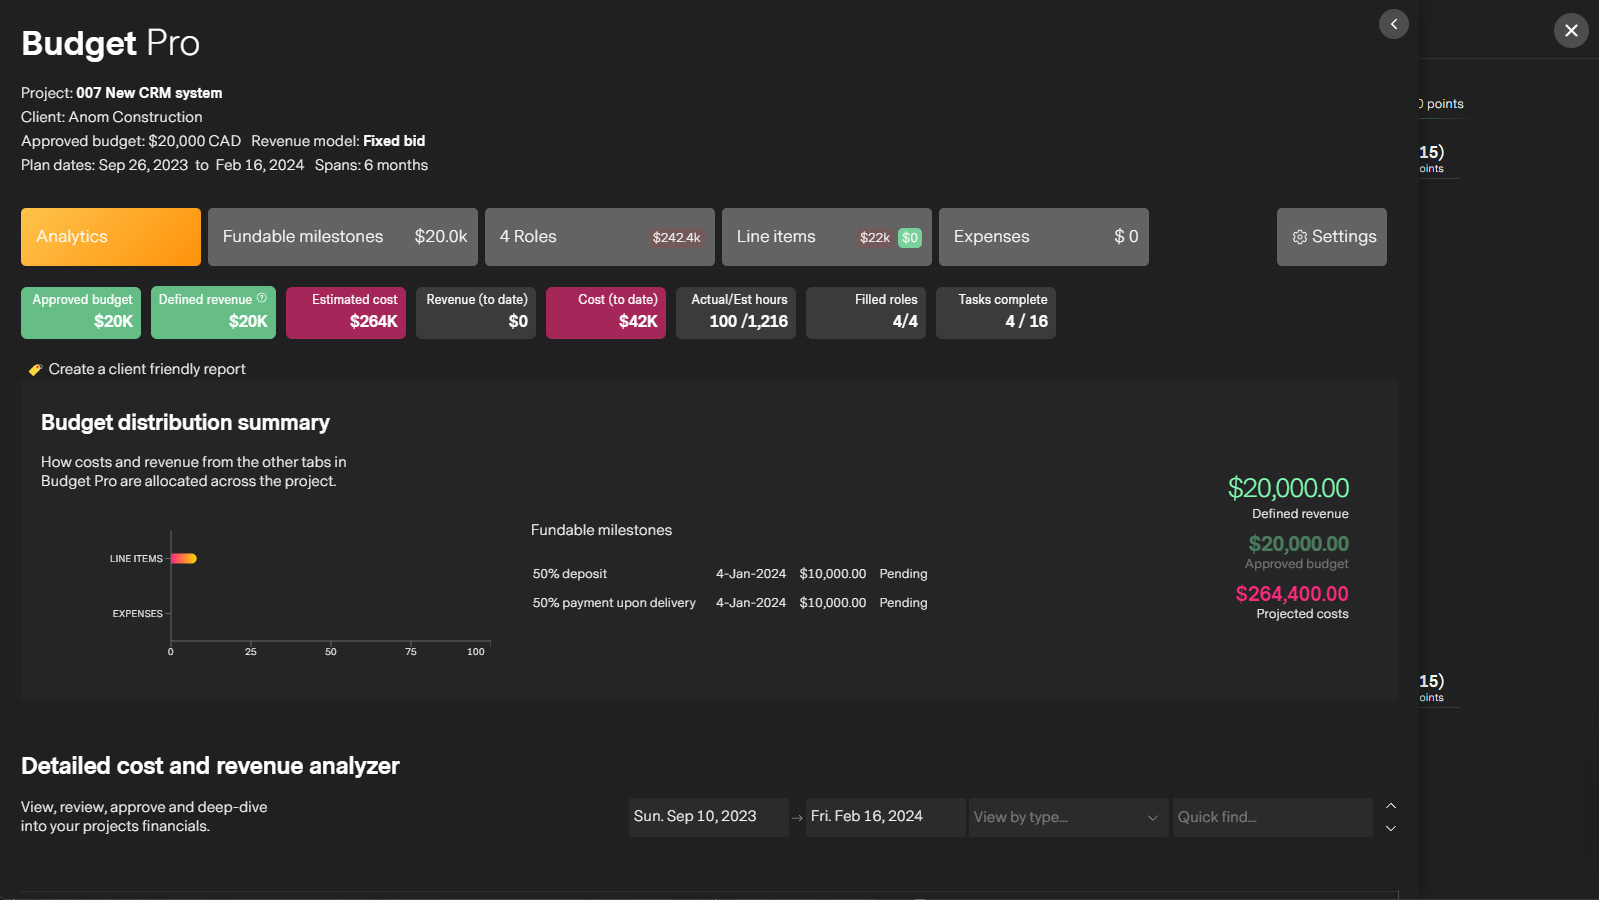
Budget Pro
One stop shop for managing your project budget and project roles. Automated reporting, fixed-bid fundable milestones, expenses, costs, revenue items, bill rates, retainers can all be defined and tracked here.
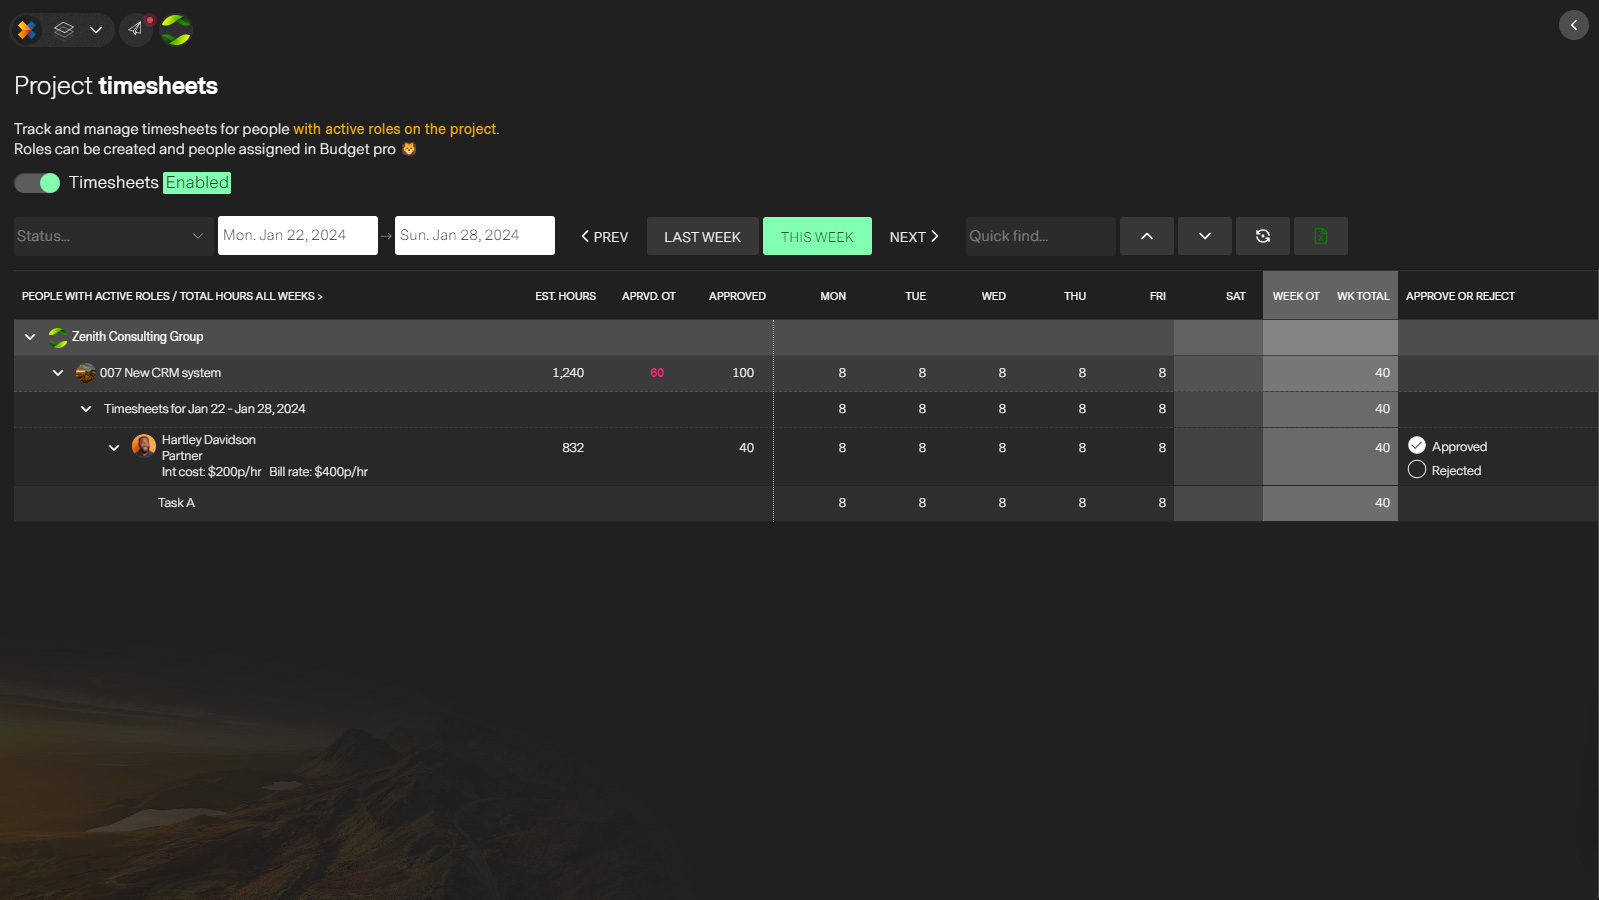
Timesheets Pro
Manage and review timesheets directly from within the project or across all projects from The PM Workspace. See overtime, missing timesheets and

Project Report
View and print a stunning, real-time report with key metrics and details spanning progress, timeline, financials and team productivity. It also happens to be client friendly.
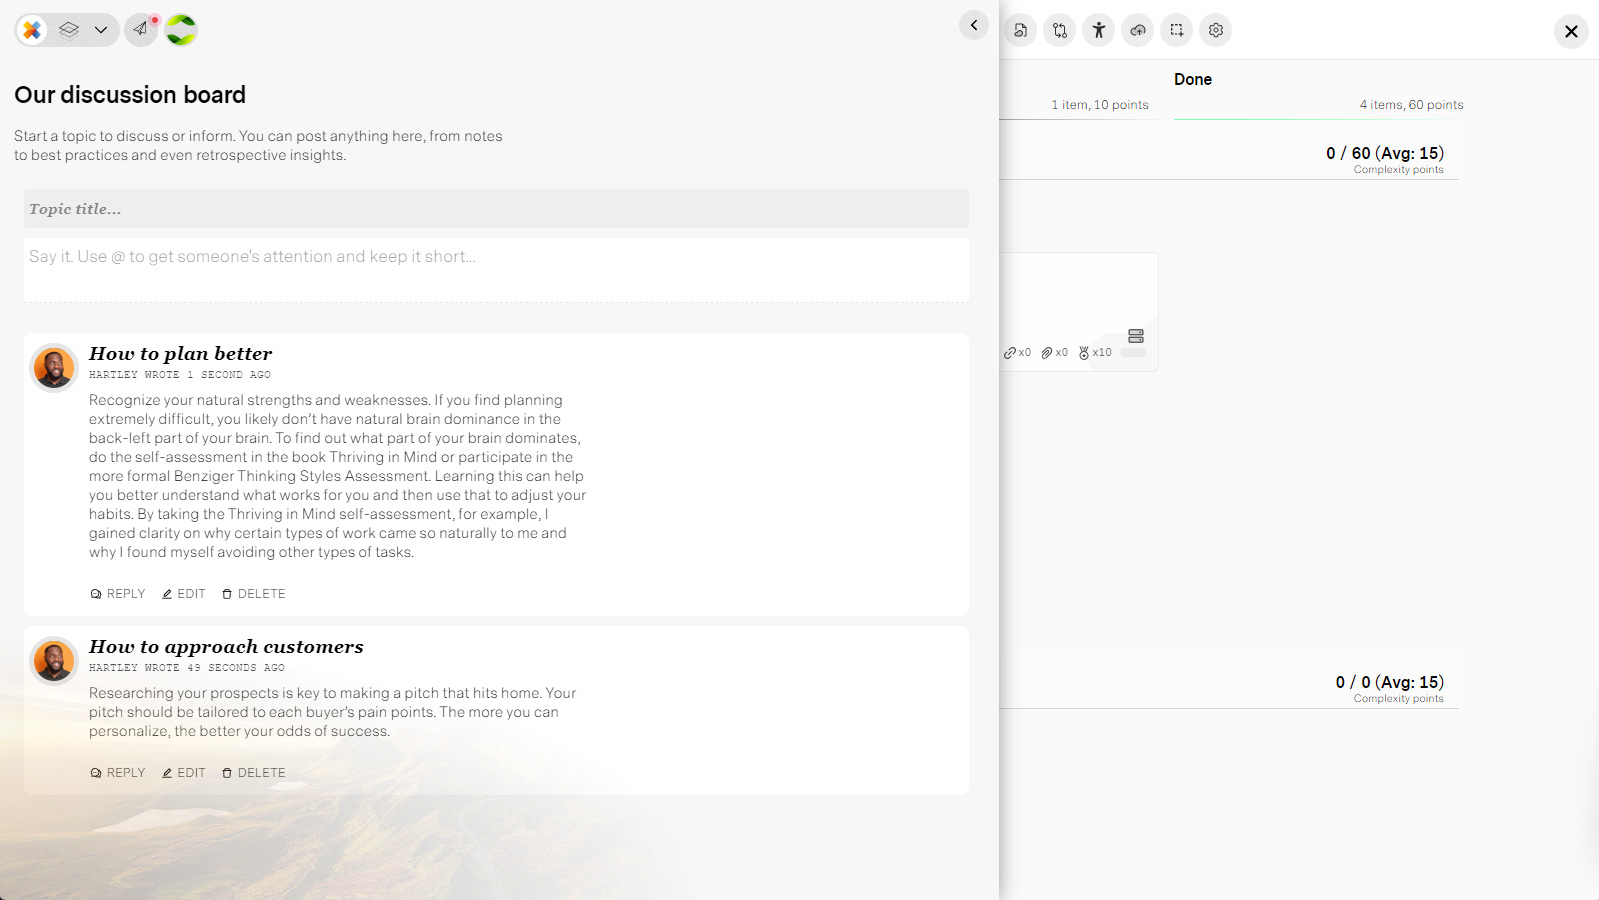
Comments/Discussions
Create discourse, solve problems, and create topics for learning and training within your project workspace. Knowledge becoems contextual and easily access by everyone. One less app to worry about.
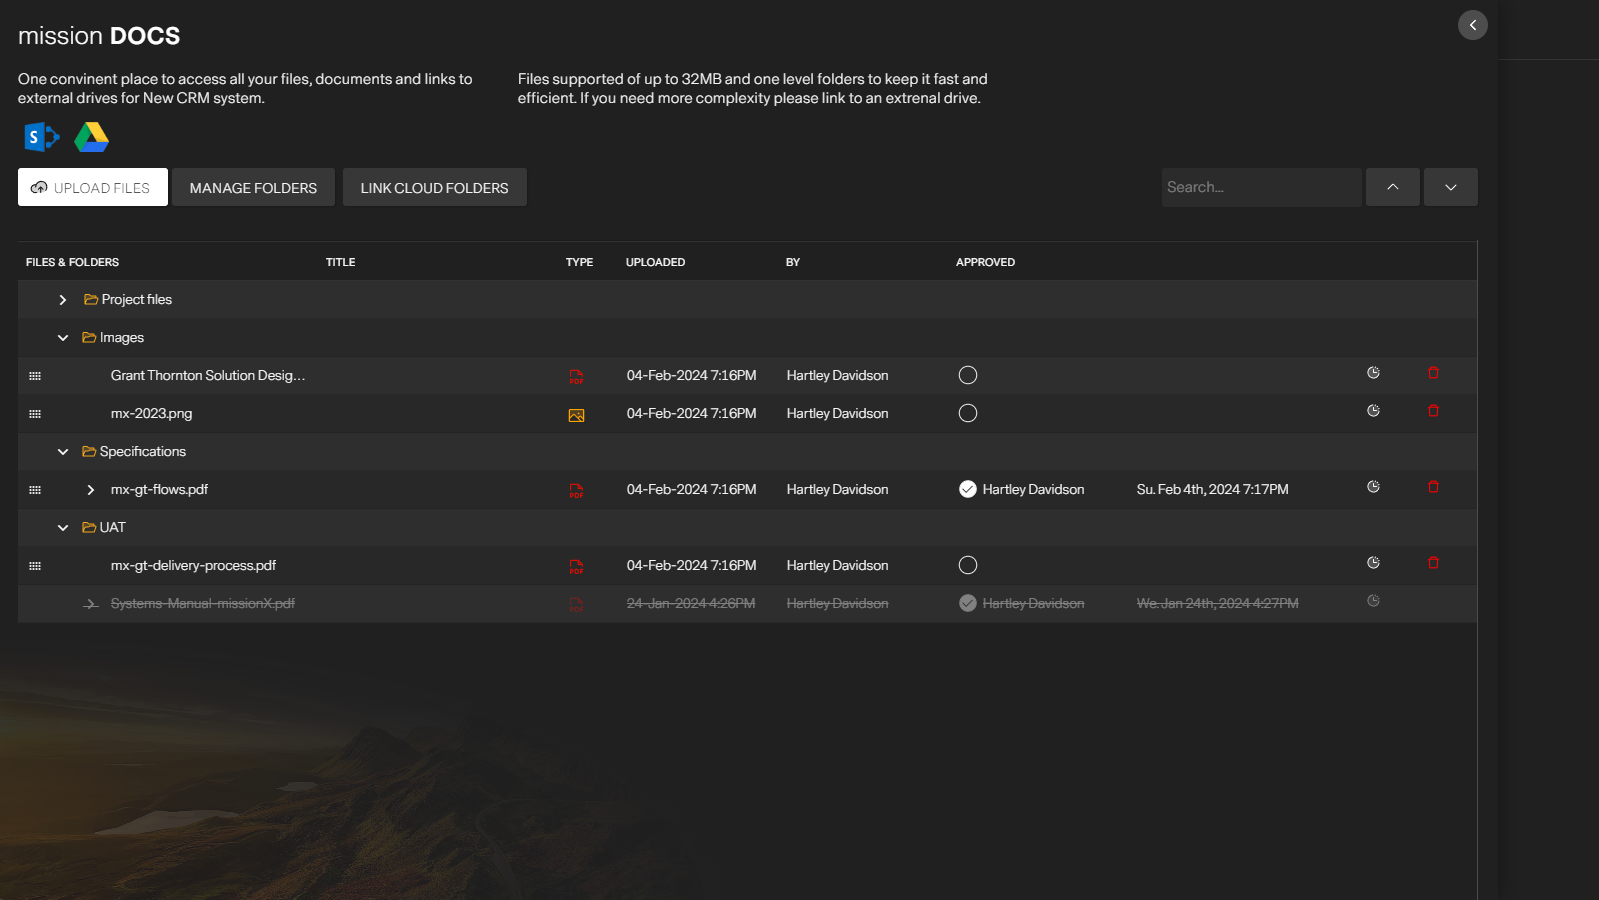
mission DOCS
Manage project files, document versions and approvals in missionX or add links to external drives and folders for easy access from tasks or the document's panel
Process Flow Maker
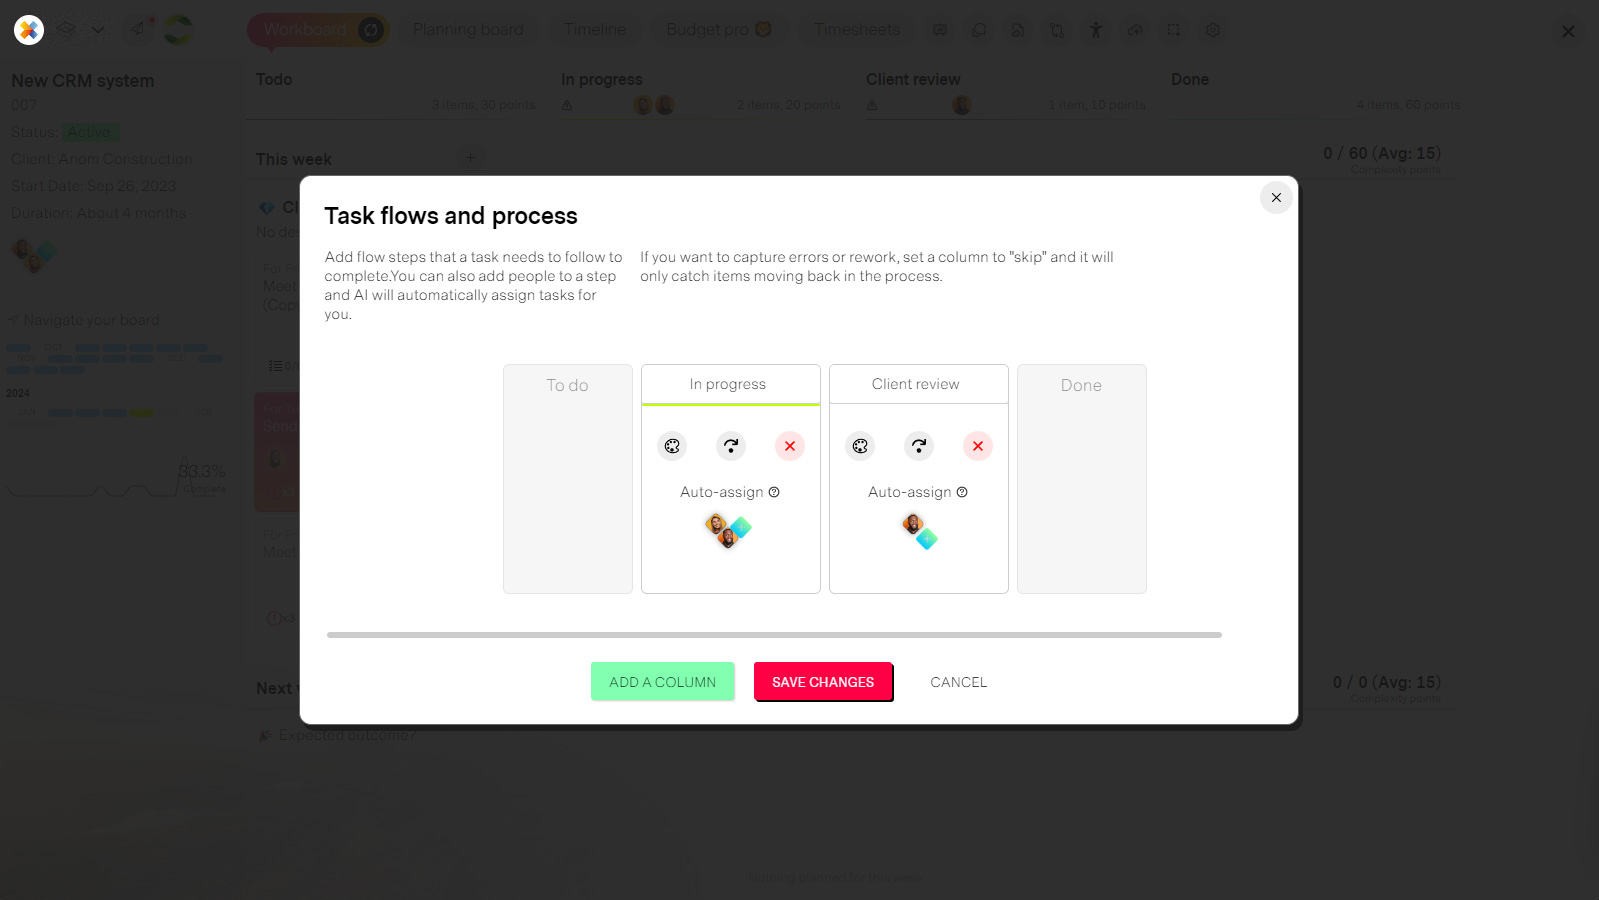
Manage your projects process flow. Add a title for each step, assign a color and optionally define who should automatically be assigned tasks when they land in their column. You can also set a column to skip forward and only capture steps going back in the process like "Re-rework" or "Changes needed"
Manage the project team
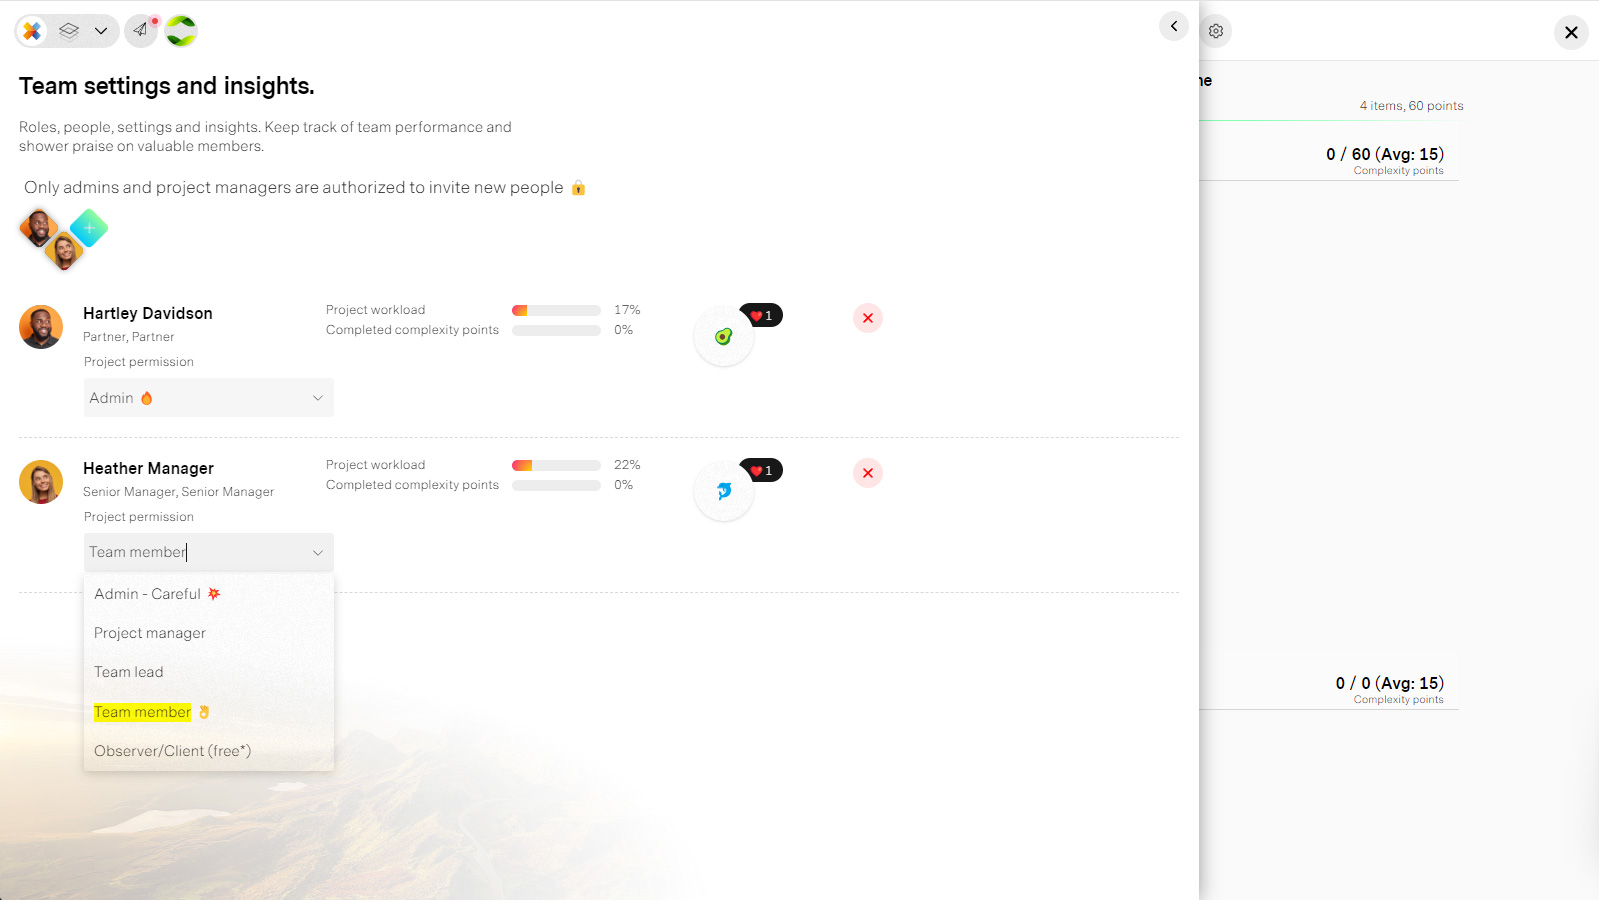
A complete view of your team where you can manage permissions, shower praise for hard work and see each person's workload
Simply effective planning
A great way to stay on top of your tasks by combining timeline Gantt style planning in a calendar view while also taking advantage of Agile best practices.
Drag, drop, resize to create your weekly plan, missionX takes care of the rest.
| Label | Feature | Description |
| A | Navigation | Seamlessly navigate to the insane amount of features your project workspace has to offer. You can even swicth workboard views from Kanban to a Simple Agile calendar view and back again to see it as a timeline. Please note: Budget pro and Timesheets are only available for Unlimited organization projects |
| B | Insights panel | Project details like project name, client, budget, duration summarized for you if applicable. Project team. A snapshot of who's on the project and the ability to invite new team members or remove existing directly from here for the project manager. All the weeks of your project are displayed here as reference points. They can also be used to navigate the Workboard instead of scrolling. |
| C | Project calendar | Each week of the timeline represents a mini project plan. The way you organize tasks for the week represents how long you plan to work on each task and when you plan to start it. |
Automate a process
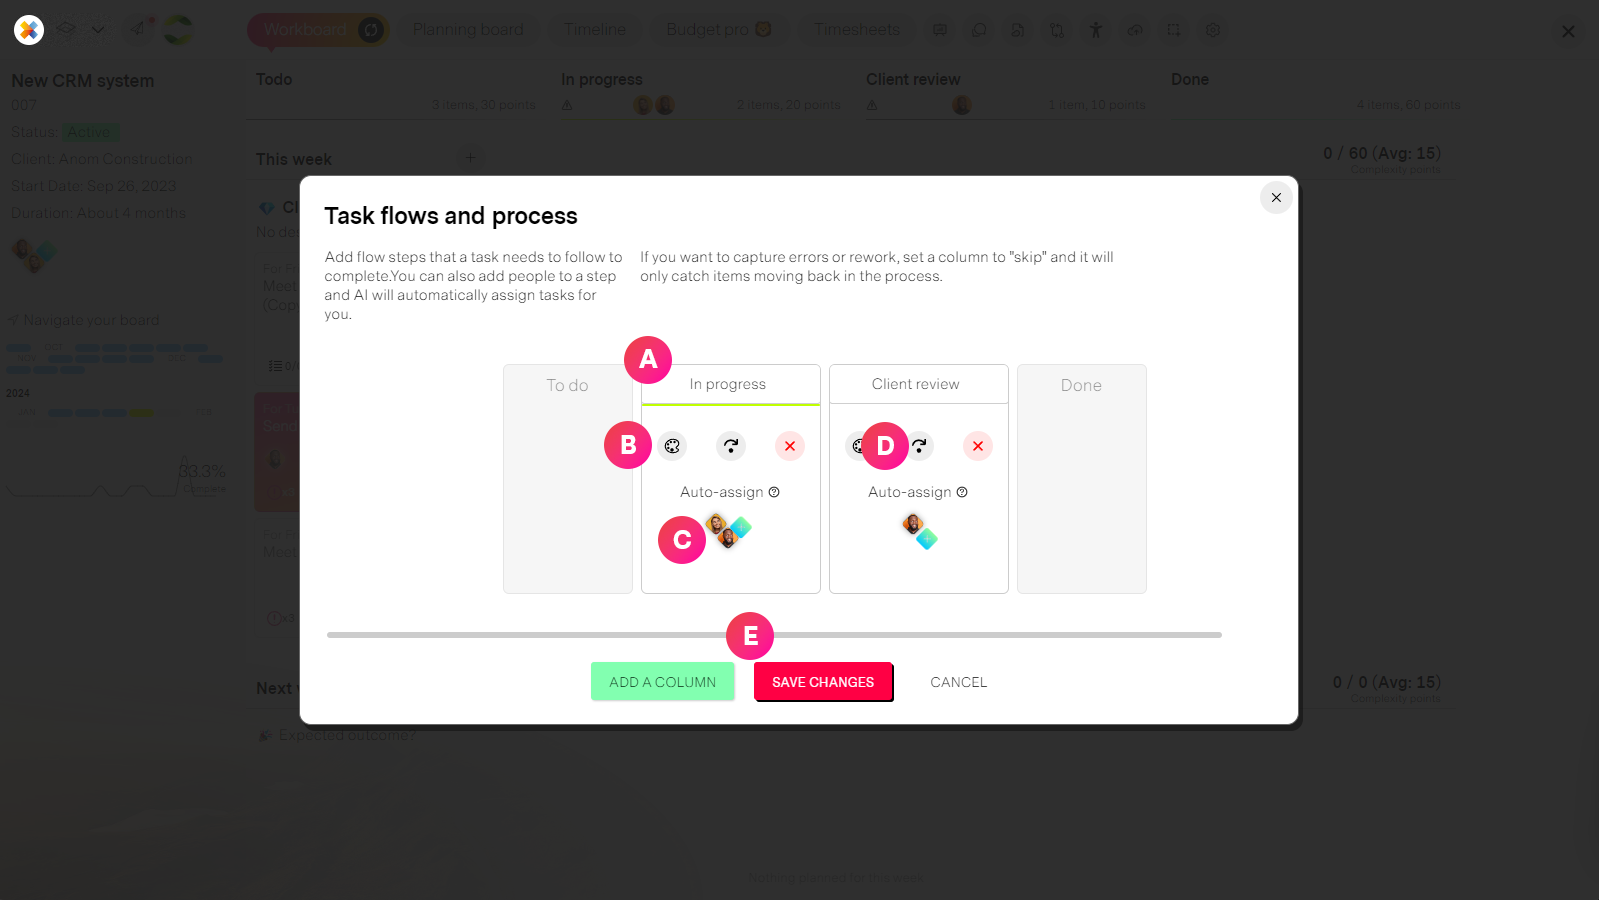
Making a linear process to follow and track task progression is easy when using the missionX flow maker. Each column represents a step in your process and has special features to help you automate tasks flowing through it.
| Label | Feature | Description |
| A | Columns (Steps) | These are the steps of the process in the order your define. If you want to change the order, simply drag and drop to reorder. |
| B | Column controls | Optionally select a color for your colum to differntiate tasks on your workboard. Delete the column. If you delete a column, any tasks in the column will be automatically taken back to the previous step. |
| C | Auto-assign | If you choose to assign people to a column, then any tasks moved to this part of the process will be automatically be assigned to the person with the most capacity. An example of this would be if you have an "Approval" step, then the person who is in charge of approving work will automatically be assigne the task and notified. |
| D | Skip steps | In some cases you may want tasks to skip steps going forward in the process but allow for items sent back in the process. A common scenario for this is "rework" or "changes needed". An example might be if your process looks like: Design, Changes and Client approves. "Changes" would then skip and tasks would go directly for approval. If for some reason it is not approved then you can send it back to "Design" This is extremly helpful if you want to spot problems or track how much volume is being sent back in the process by looking at the colum header's details. |
| E | Flow controls | Add a a new column from here and save any changes before exiting. Please remember to save your changes. This is one of the few places where missionX does not autosave for you. |
Organizing your work
Your Planning board represents what needs to be done, and your the Workboard when it needs to be done.
Many people will view this as their "Backlog" or "Work Breakdown Structure" or "WBS". In simple terms this is where you can organize tasks into "Buckets" or "Phases" of work.
For example: A project to create a new product may have the following phases:
Research, Analysis, Design, Engineering, Testing, Marketing, Sales.
Please note that a todo item can function both as a task and story for those used to Agile terminology
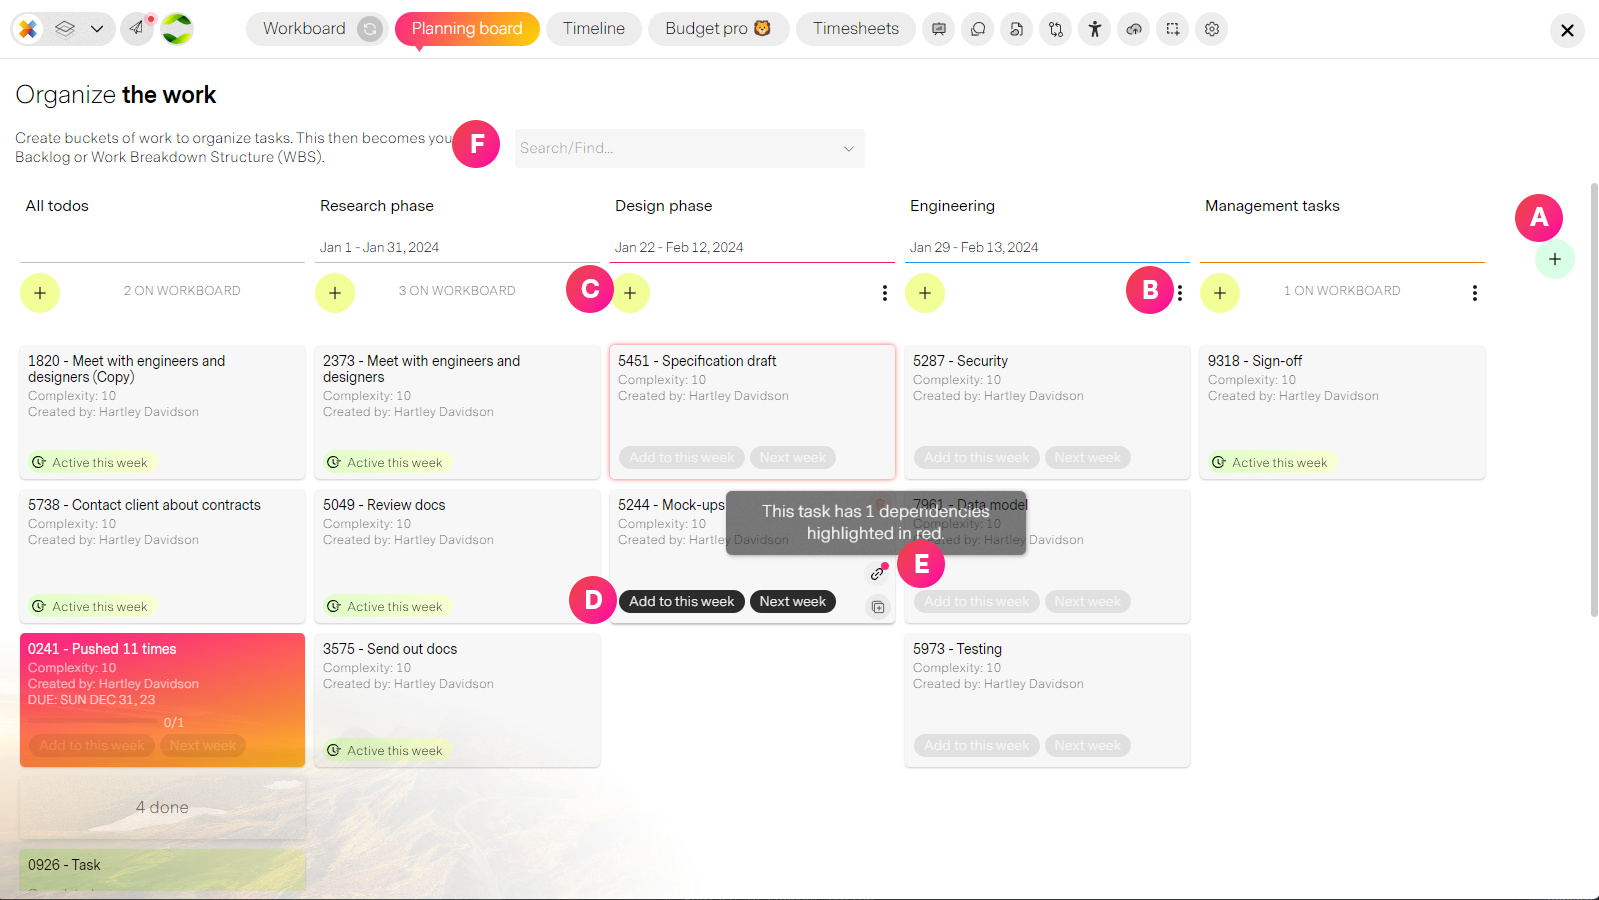
| Label | Feature | Description |
| A | Add a new column | Add a phase or epic for your project. Phases can have an optional start and end date. If you decide to add dates then your phase will appear on the project timeline otherwise it will only appear here as a bucket of work. |
| B | Column controls | From here you can:
Please note: If you delete a column with tasks in it and decide not to also delete the tasks, then thos task will automticall go to the defauklt todo column at the start of your part board. |
| C | Adding tasks/stories | Add tasks or stories directly to a column. Phases can be moved to other columns by dragging and dropping if you are the project manager or task owner |
| D | Move tasks to Workboard | Once you are ready to work on a task you can add it to your workboard using the controls here. Tasks can be added to this week or next week. This is because we encourage weekly planning and completion cycles to keep teams motivated and the risk of delays low. Once a task is on the Workboard, you can move it to other weeks if you want to plan further ahead. You can also give tasks due dates into the future past the two weeks. |
| E | View dependencies | If you create a dependecy from one task to another task (one has to finish before the other can start) then you can see it here. If you mouse over the link icon, all tasks that depend on the one you are over will appear highlighted. |
Agile planning
You may have never heard of Agile, or you are a seasoned scrum master. Either way missionX helps you embrace and roll with change. Change is the only constant in project management because s*#! happens.
Working to small, bite-sized goals or "outcomes"
Agile helps you plan your work into one, or two week increments called Sprints. Each Sprint needs to have a clear and easily understood goal: For example a Sprint goal may be "Complete the buy now button" or "Users can register for our newsletter".
Now that you have your goal or "outcome" you can plan what tasks (sometimes called stories) are needed to make this outcome happen.
Agile baked-in
By organizing your workboard into weekly increments and allowing you to define outcomes within a 3 week period from today, missionX helps newcomers apply Agile ideas without having to know the details.
Scrum masters can benefit greatly from treating the Planning board as their Backlog and viewing Sprints on the Workboard. This helkps visualize work and outcomes when refining the backlog and Sprint planning.
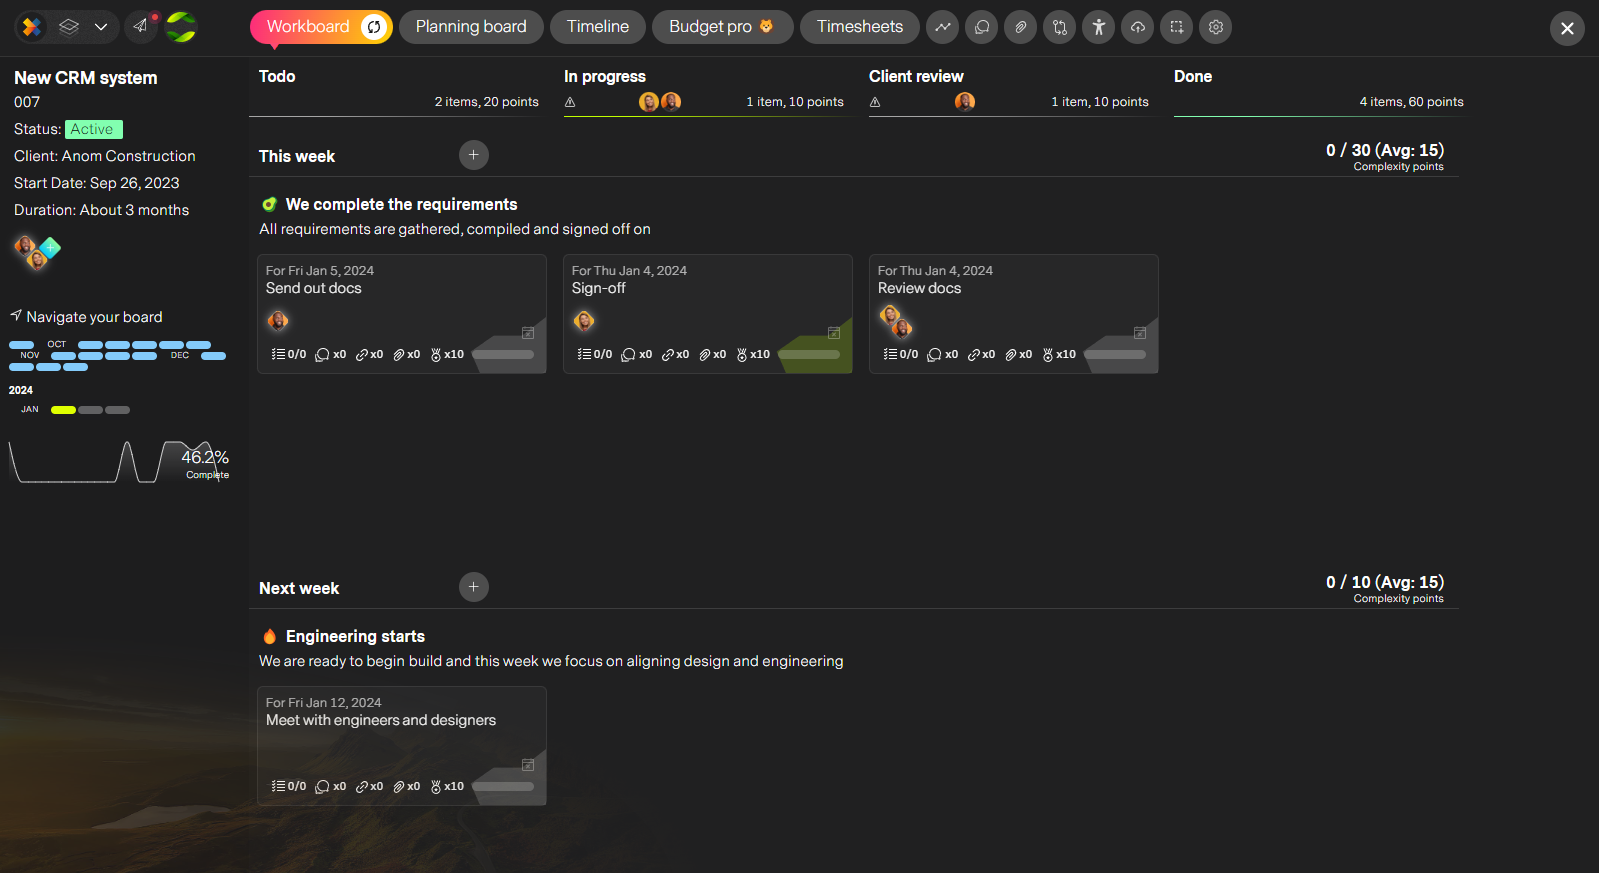
Benefits of Agile in missionX
The biggest benefit is that when change happens it is easy to adapt and manage as you are working to weekly outcomes, not hiding a ton of work under month long tasks that if delayed nobody uncovers till it is too late.
- Easy to manage weekly planning
- Clear goal setting
- Visually enhance Scrums and Sprint planning
- Automatic output calculations - how much can a team deliver each week
- Automatic burndown calculations
- Flexibility to jump between tasks as you wish within the week
Tracking progress
Reporting for your project and tracking progress is extremly easy because it's done for you. With one click you can create a beutiful, sophisticated report for sharing with you're team, management or clients.
There are many ways to view reports in missionX but here we are looking at the Client report from your project workspace navigation bar.
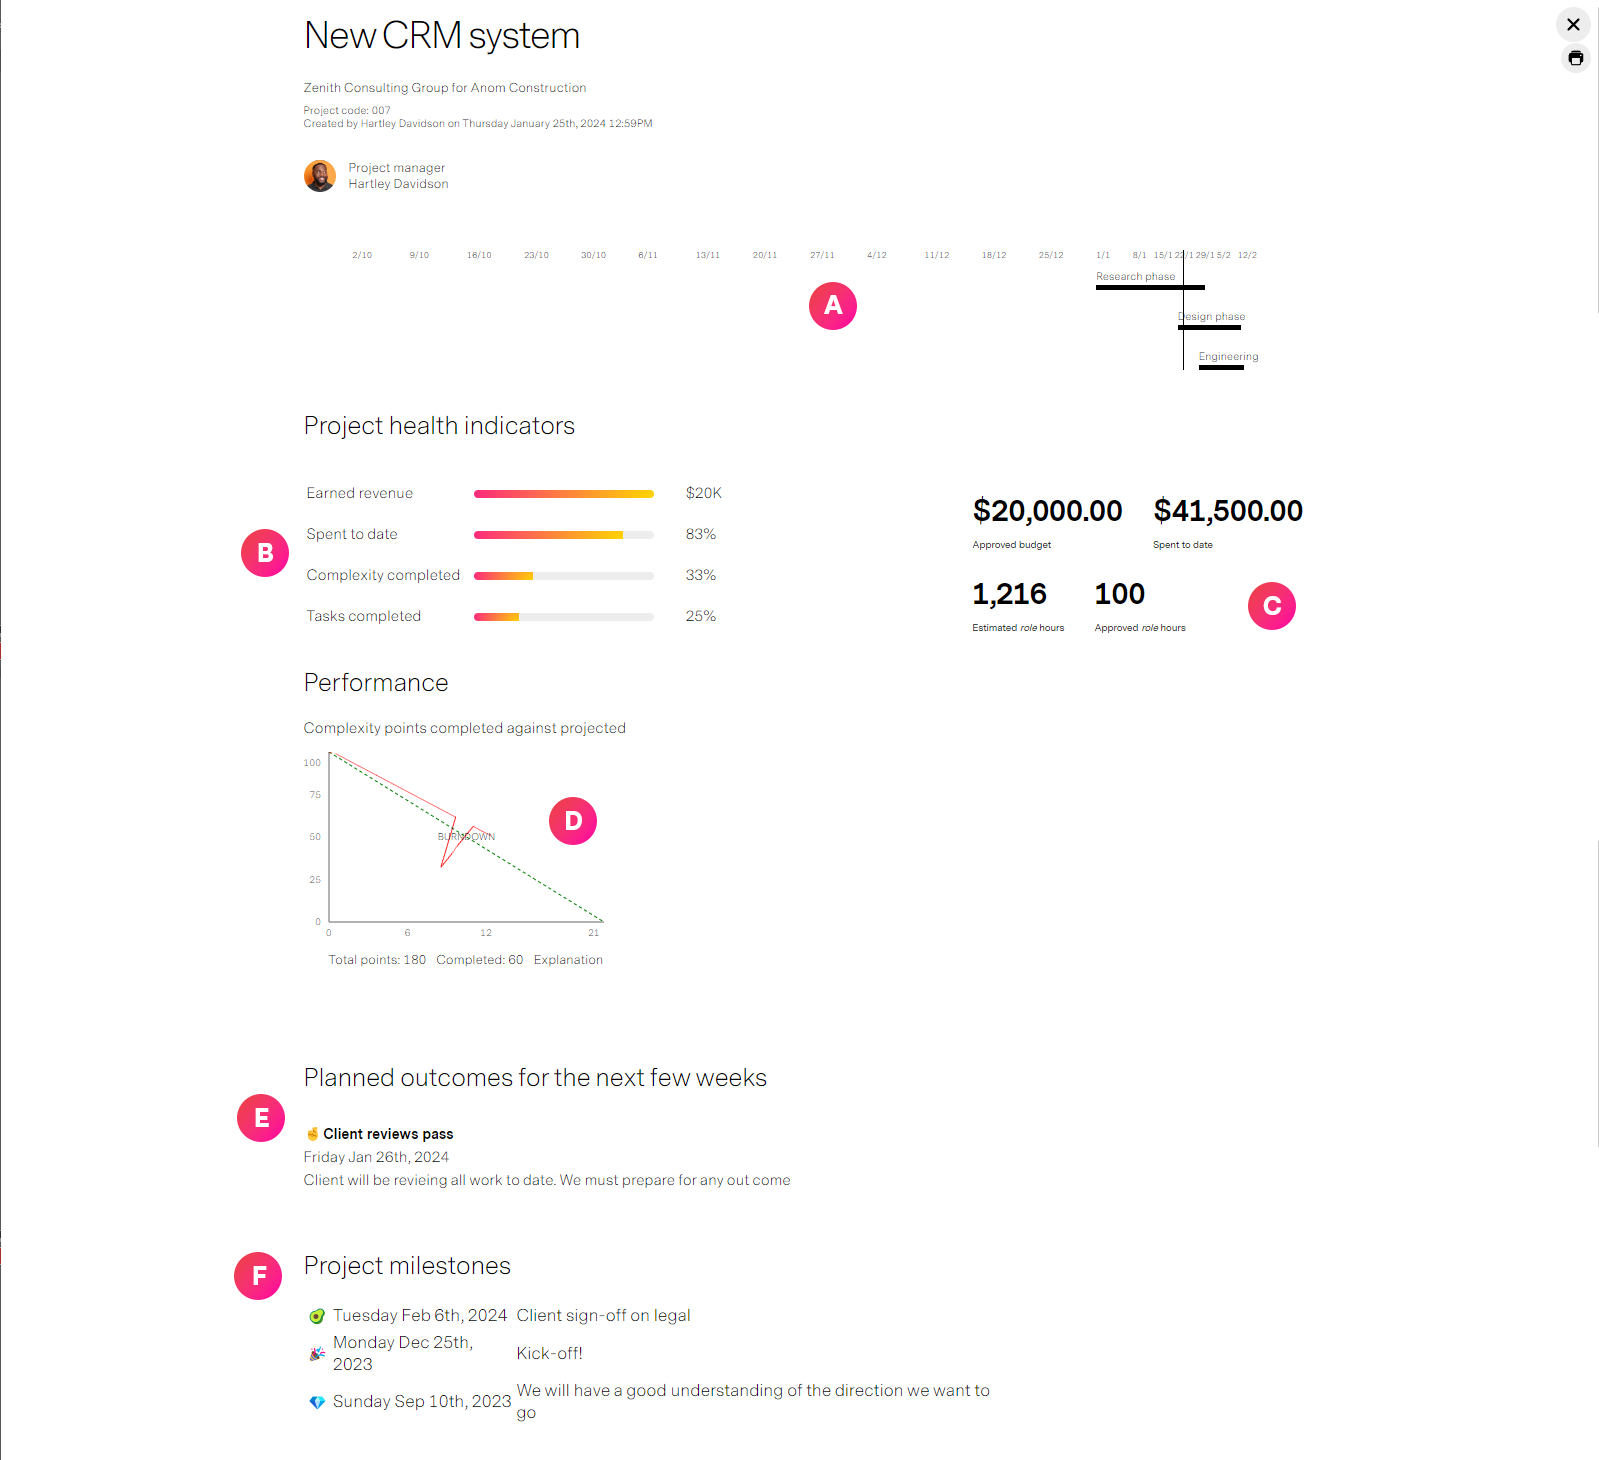
| Label | Feature | Description |
| A | Project timeline | If you have defined phases with dates in your Planning board then they will appear here to show completion progress |
| B | Health indicators | An overview of some key indicators like earned revenue (if the project is billable), spent to date (if you are tracking costs) and complexity completed. Complexity points define how much work is required to complete a task and allows you to guage how much effort will be required to complete remaining tasks |
| C | Approved vs Actual | For many client projects you will need to track performance against approved budget and hours. missionX summarizes it here for you by incorporating timesheet data if timesheets are enabled. |
| D | Burndown chart | Your Burndown chart represents the amount of work defined vs how much of that work has been completed. This is all based on Complexity points that are defined for each task and not the number of tasks. This is important because you may have 20 tasks left but they may all be extremly hard to complete and require a long time so number of tasks is not the best way to track work completion. The bottom axis is the weeks in your project, the Y axis on the left is how many complexity points are planned for. The middle green diagonal line is how many points need to be completed each week for you to deleiver on time. Now the red line is your burndown, how are you doing completing work on a weekly basis and at what rate you will finish. It should closely match the green line. It the red line is pointing before the green line great, you are finishing early but if the red line is trending to the right of the green line. you are heading for delays and you will need to complete more work to get it back on track. Structured Agile projects will show a Burndown chart for every workstream, POD or phase in your project |
| E | Outcomes | A summary of what you plan to accomplish in the next few weeks. |
| F | Project milestones | You can add milestones from your project timeline. These are different than outcomes in that they represent key momnets for your overall project like "Client sign-off", or "Go live" |