
 Launch
Structured Agile
The ultimate Agile tool kit for projects and programs facing real-world deadlines with multiple phases, teams, backlogs and many moving parts to manage.
Power Project Management
The most advanced and innovative project toolkit available. Designed to fully manage Agile sprints across multiple teams and PODs but still track progress to a high-level roadmap. This is the Program manager's dream come true.
This project type is ideal for long complex projects but also for internal change teams working in PODs.
Advantages of Structured Agile
- Define a structured roadmap that clients and stakeholders can easily understand and follow
- Track multiple workstreams and backlogs from one place
- View dependencies amoung different teams and phases
- Link and automate Epics and Sprints with your roadmap
- Advanced Sprint planning and Backlog refinement
Tour the Structured Agile workspace
Shown in both Dark and Light modes. Both are supported, you decide.
Tip: Click on an image to zoom.
- Our story
- Roadmap
- Epic timeline
- Epic workspace
- Sprint runner
- Budget Pro
- Timesheets Pro
- Project Report
- Comments/Discussions
- mission DOCS
- Process Flow Maker
- Manage the project team
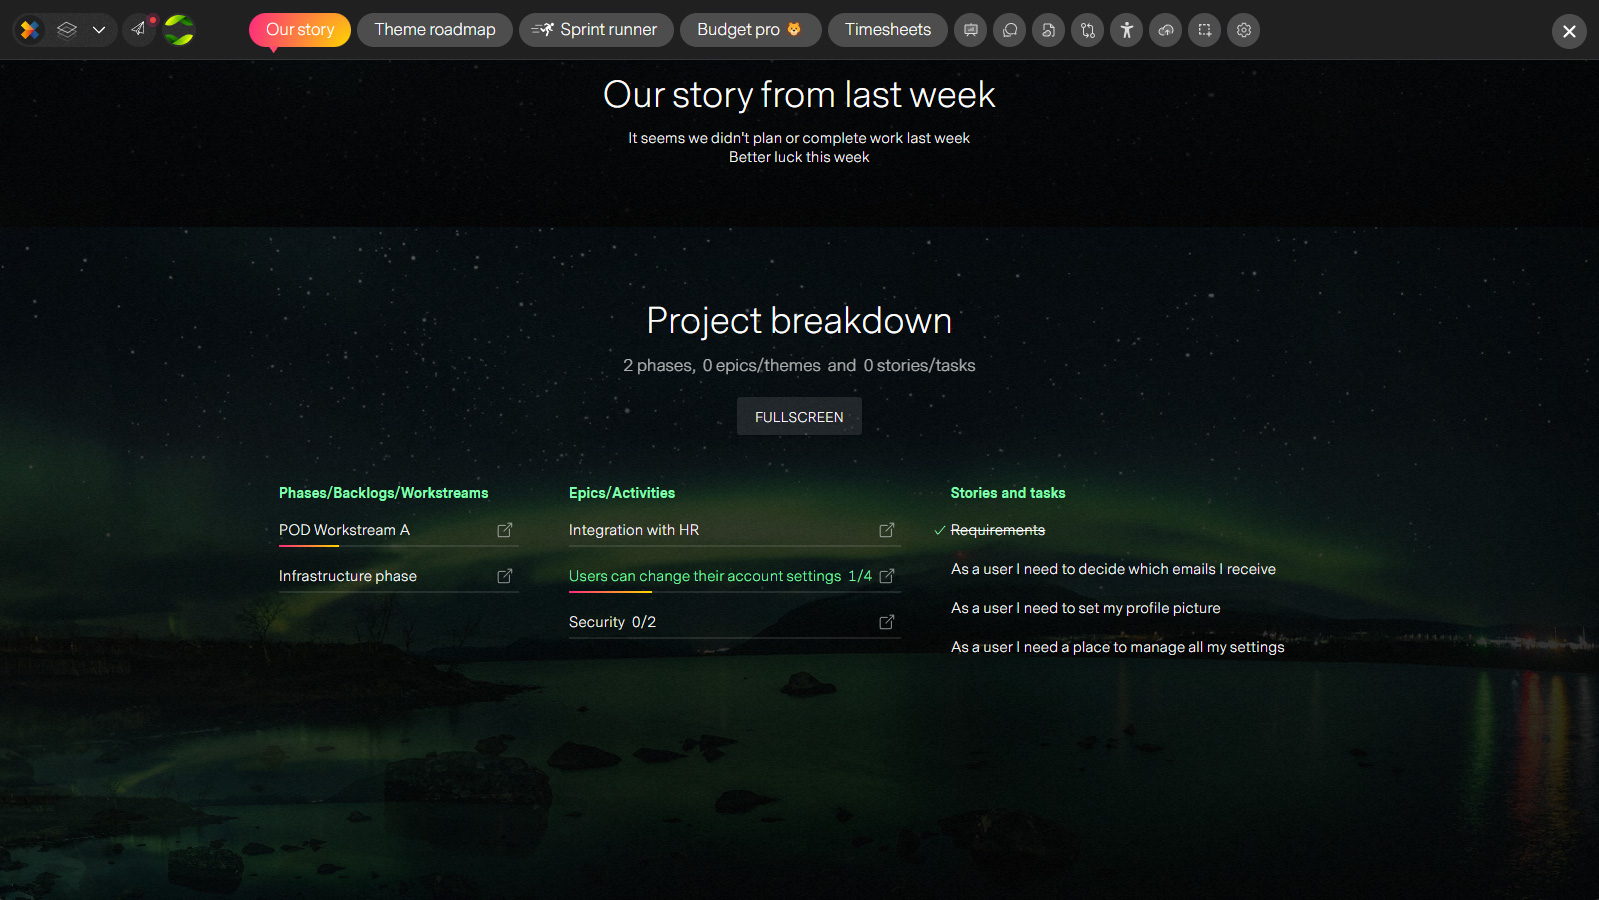
Our story
A gorgeous project showcase screen that summarizes project details, financials and weekly progress in easy to understand language and visuals.
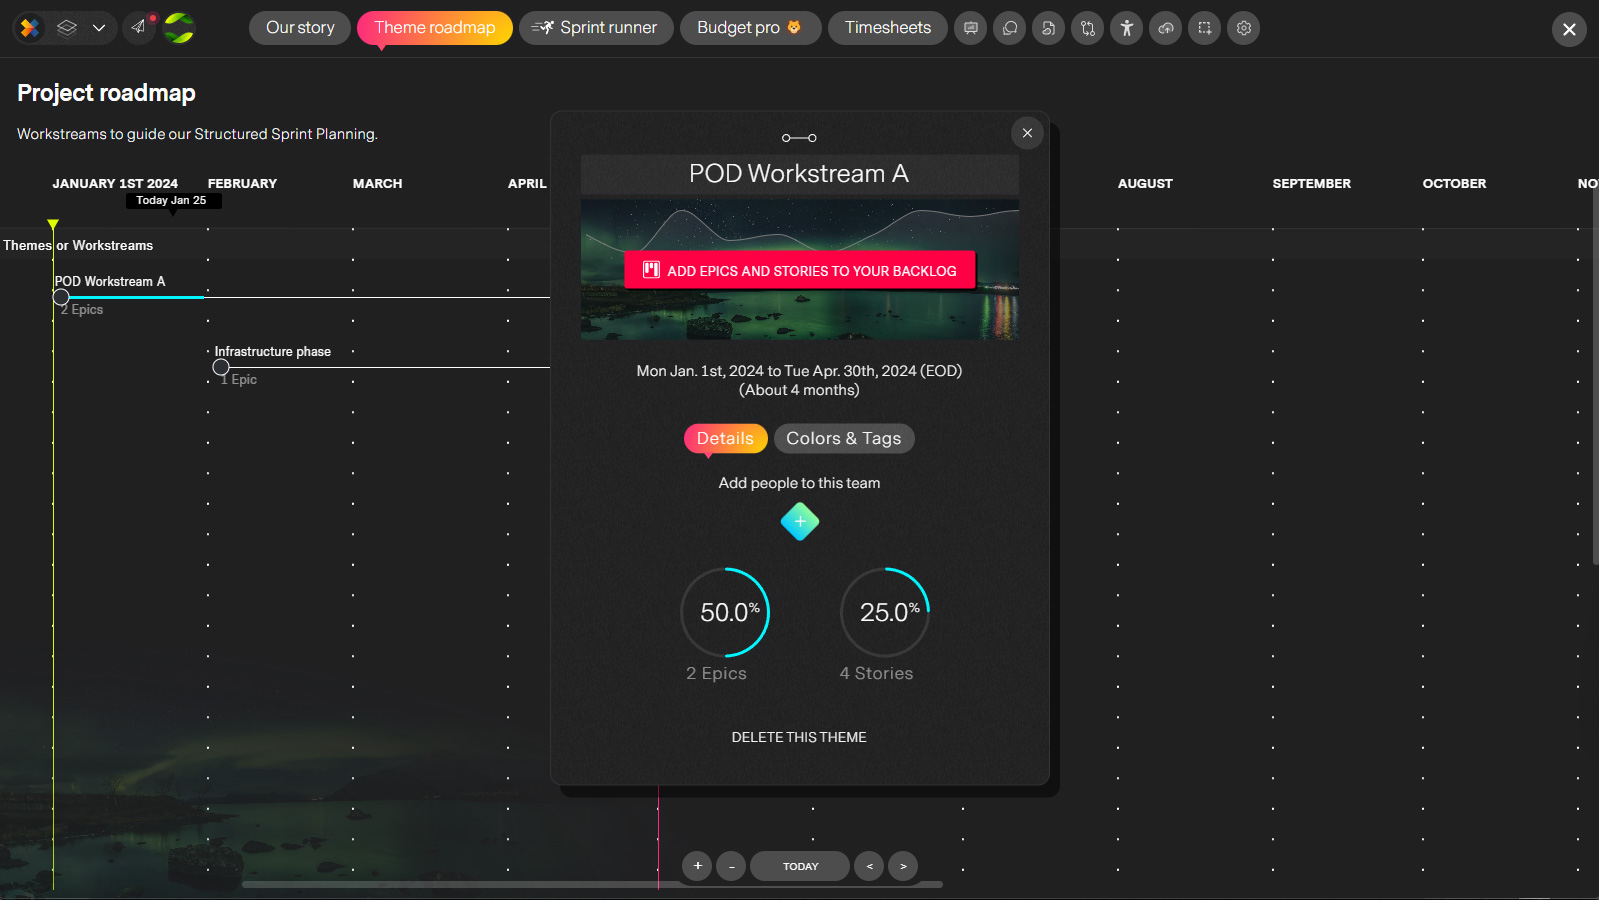
Roadmap
Structure your work and Sprints in an easy to follow roadmap for the project. Draw and visualize phases, milestones, backlogs, themes or workstreams... whatever you need to track to a timeline. It is also flexible enough to handle internal PODs as timelines keep rolling over every week until ended.
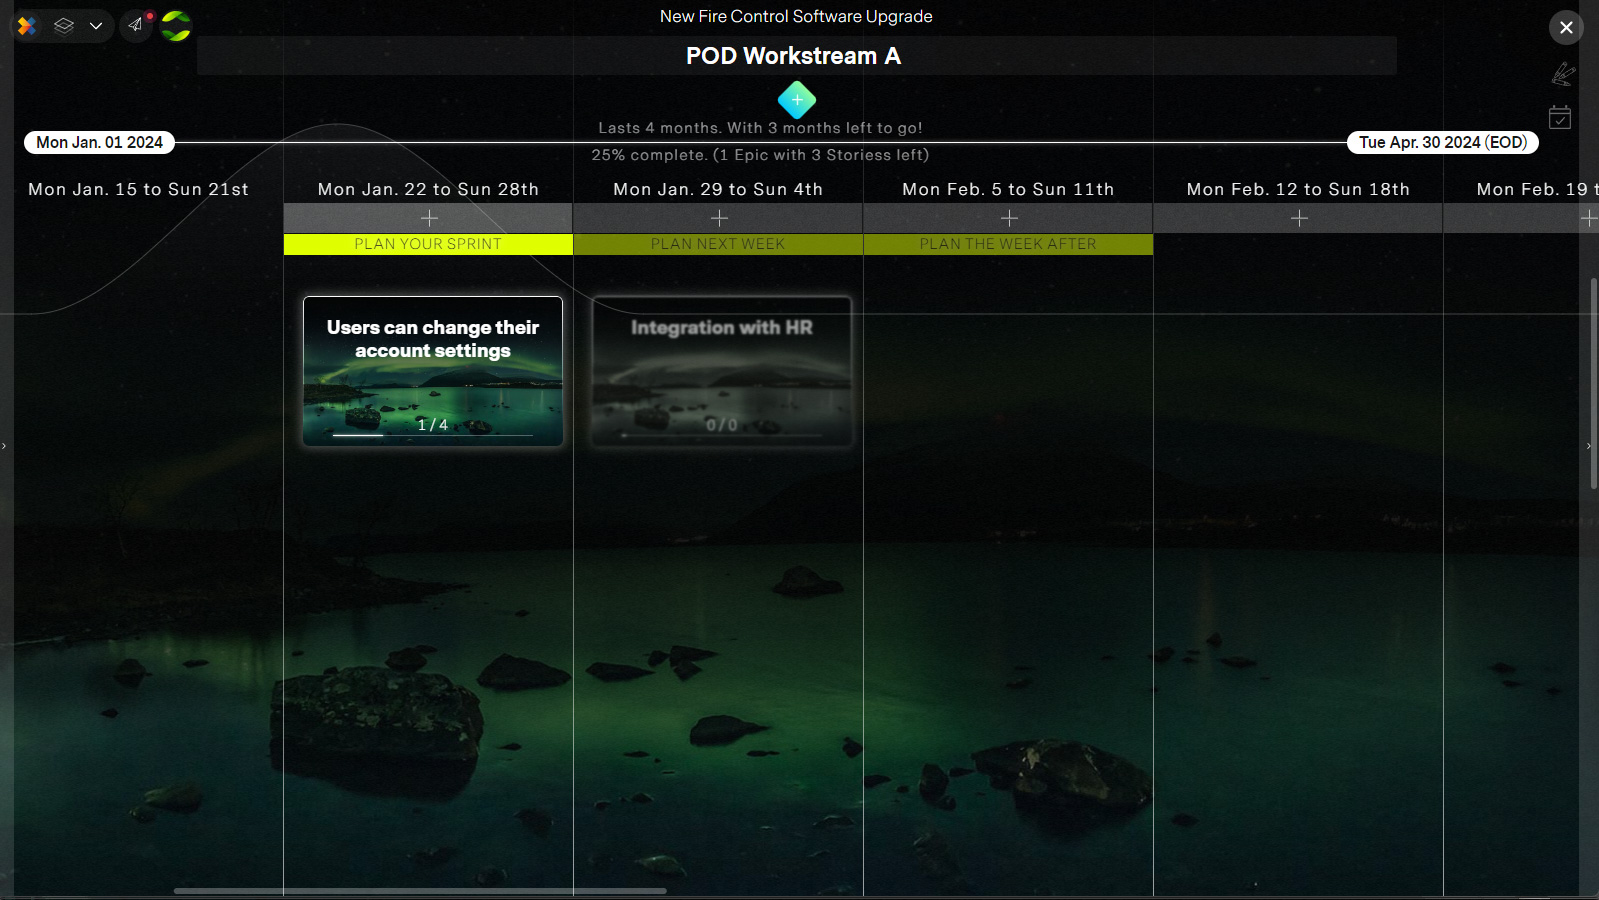
Epic timeline
Define when Epics are eligible for Sprint planning. Epics roll over until finsihed so the timeline just controls when teams can work on certain Epics.
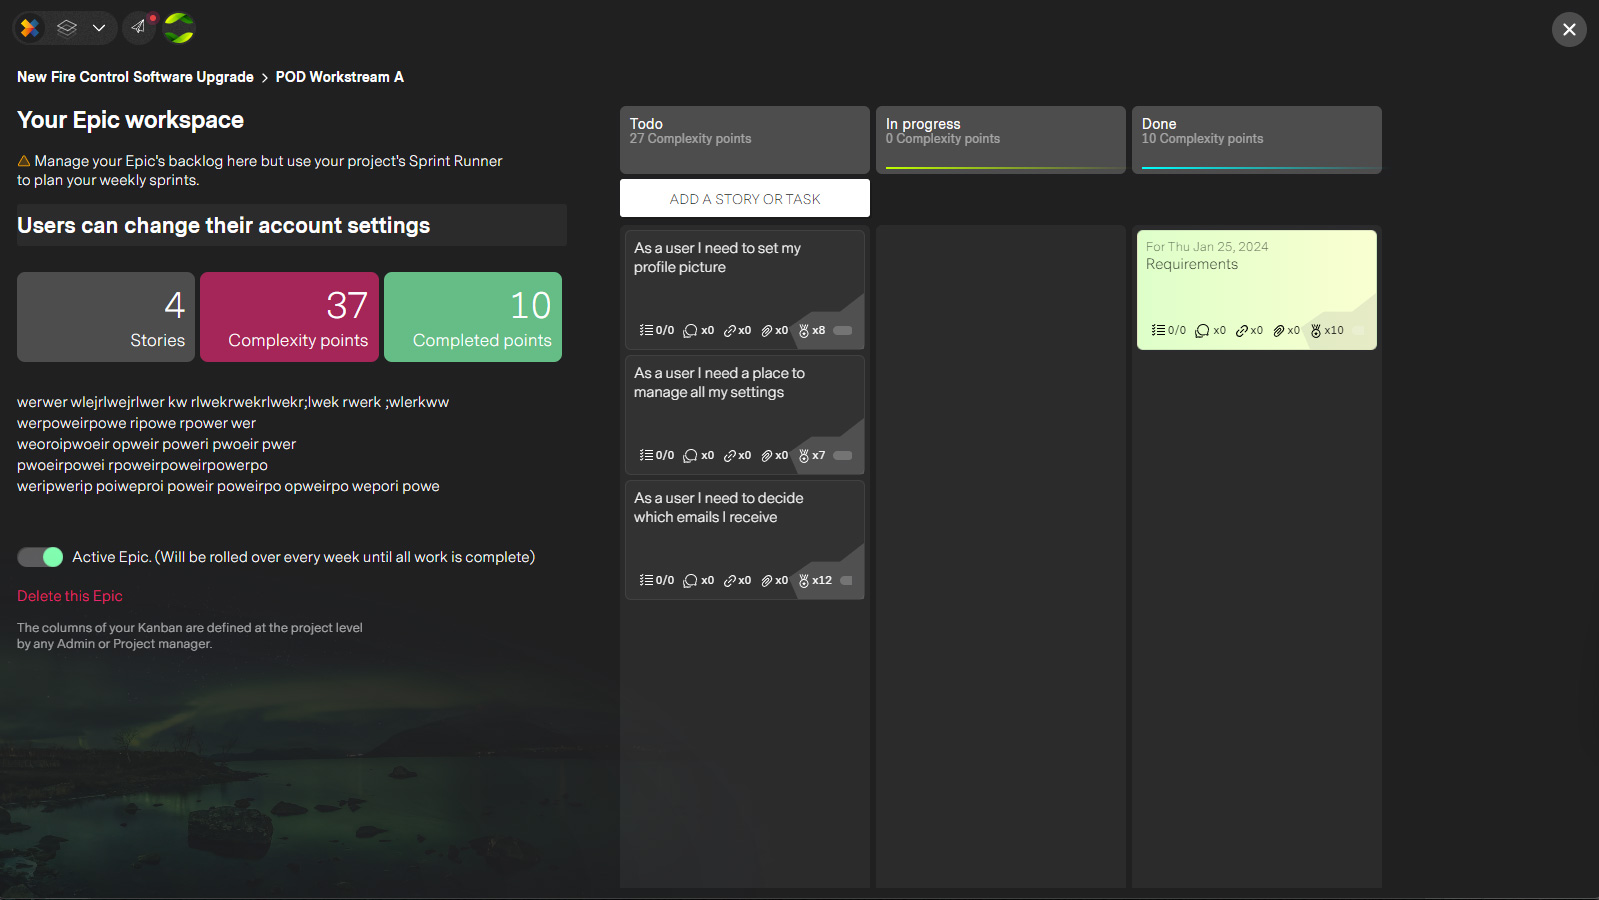
Epic workspace
Manage and plan your Epic's Stories and Tasks in one workspace.
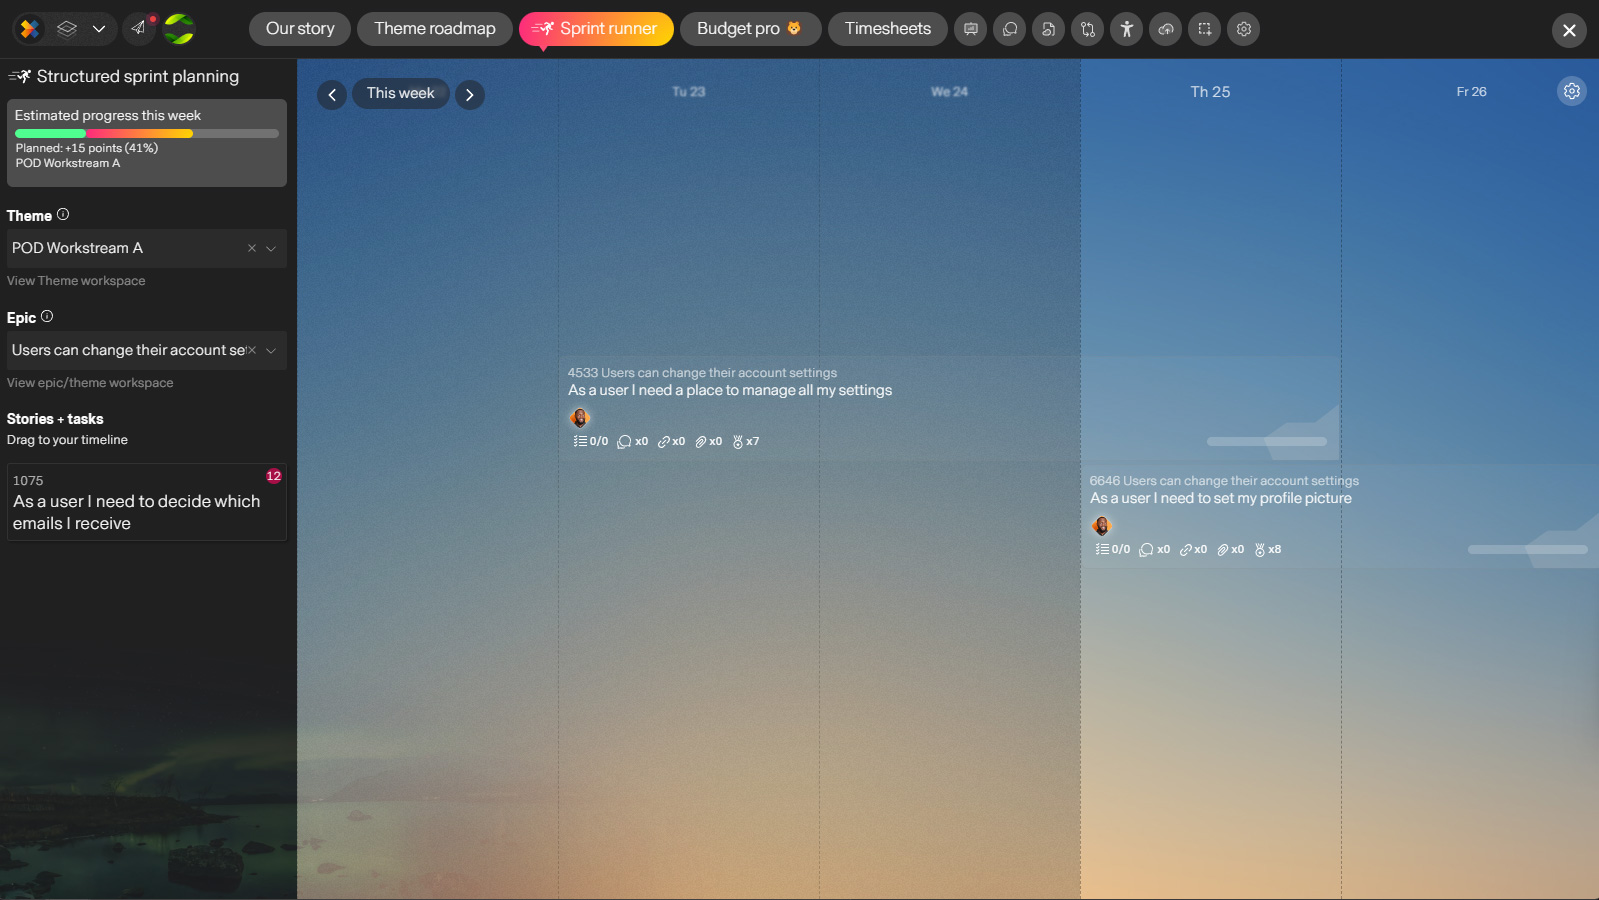
Sprint runner
Where the Roadmap, Epic timeline and Epic workspaces come together. Weekly Sprint planning by dragging, dropping and resizing Stories and Tasks to plan your weekly Sprints.
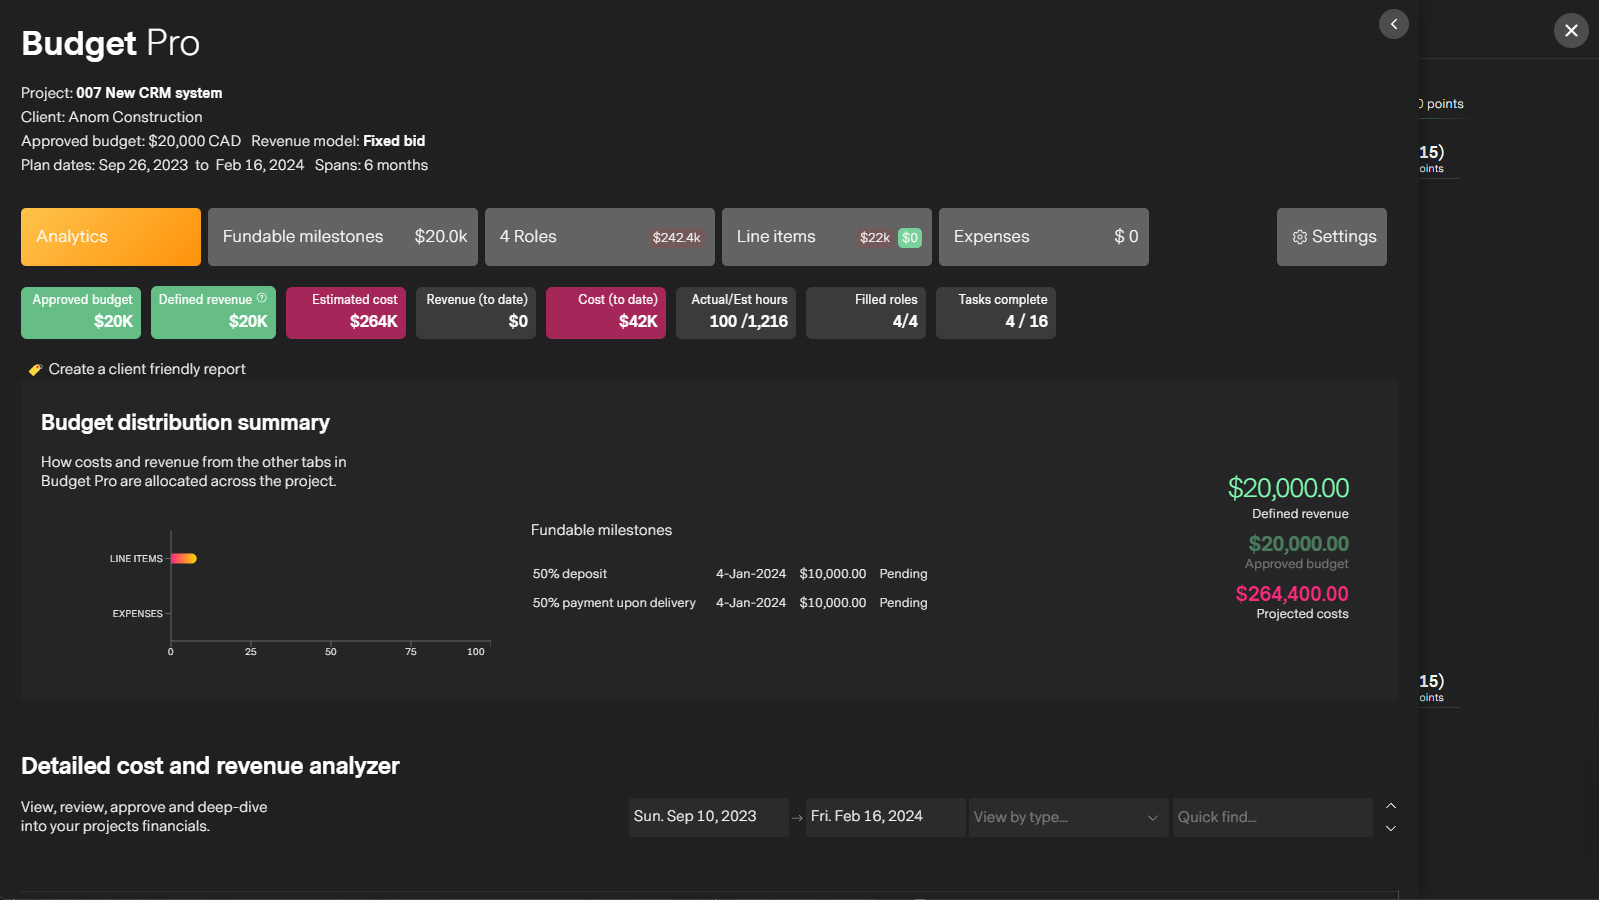
Budget Pro
One stop shop for managing your project budget and project roles. Automated reporting, fixed-bid fundable milestones, expenses, costs, revenue items, bill rates, retainers can all be defined and tracked here.
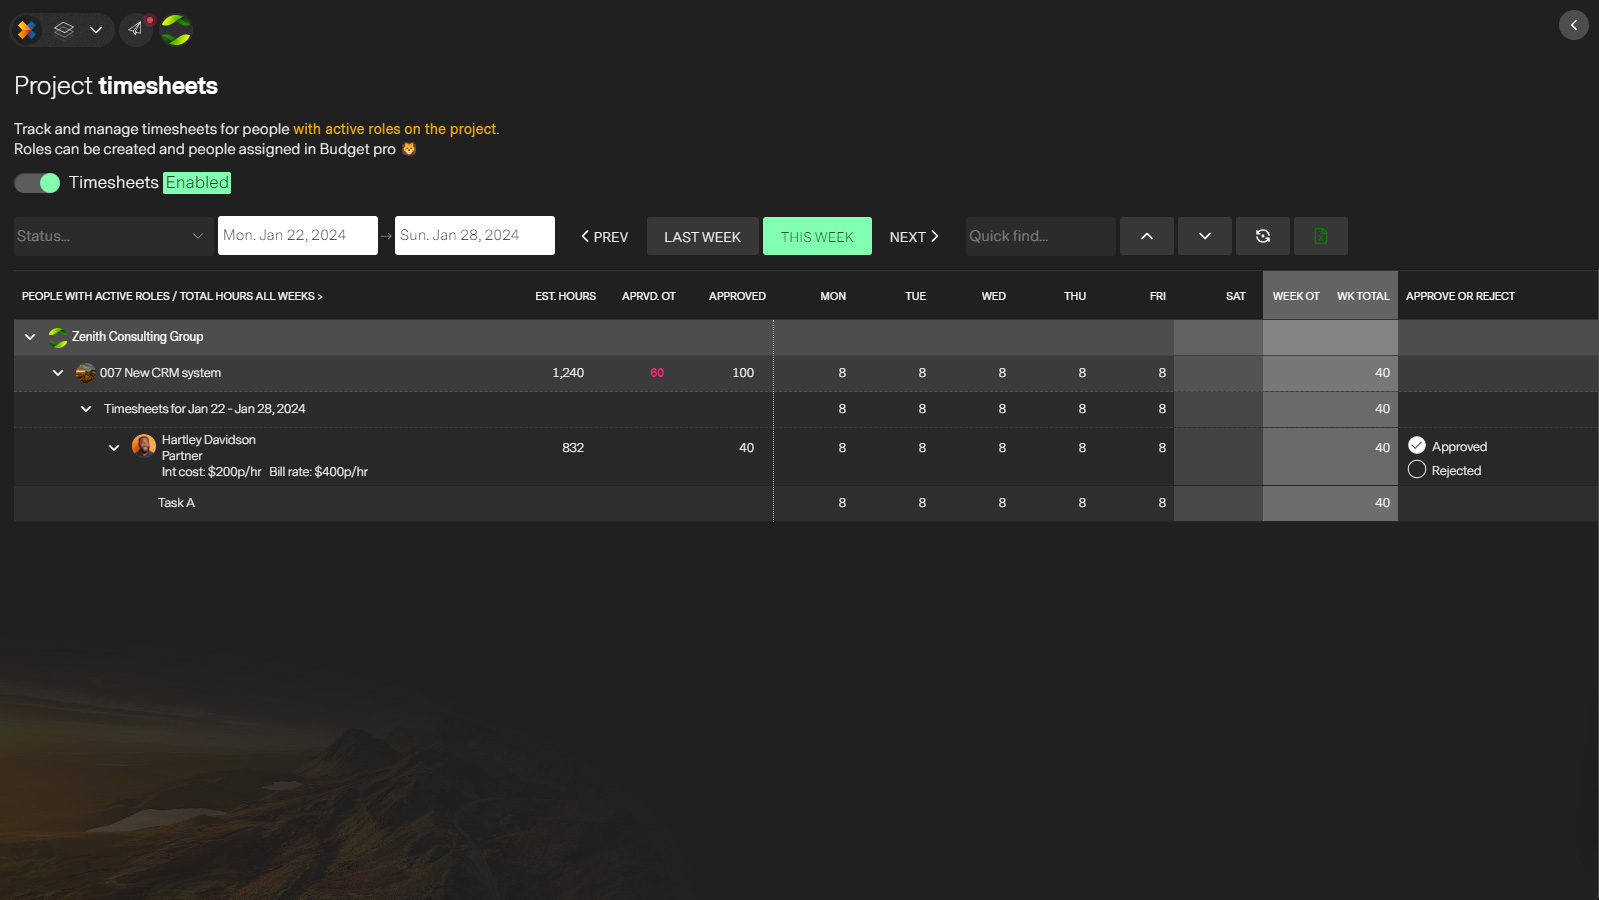
Timesheets Pro
Manage and review timesheets directly from within the project or across all projects from The PM Workspace. See overtime, missing timesheets and

Project Report
View and print a stunning, real-time report with key metrics and details spanning progress, timeline, financials and team productivity. It also happens to be client friendly.
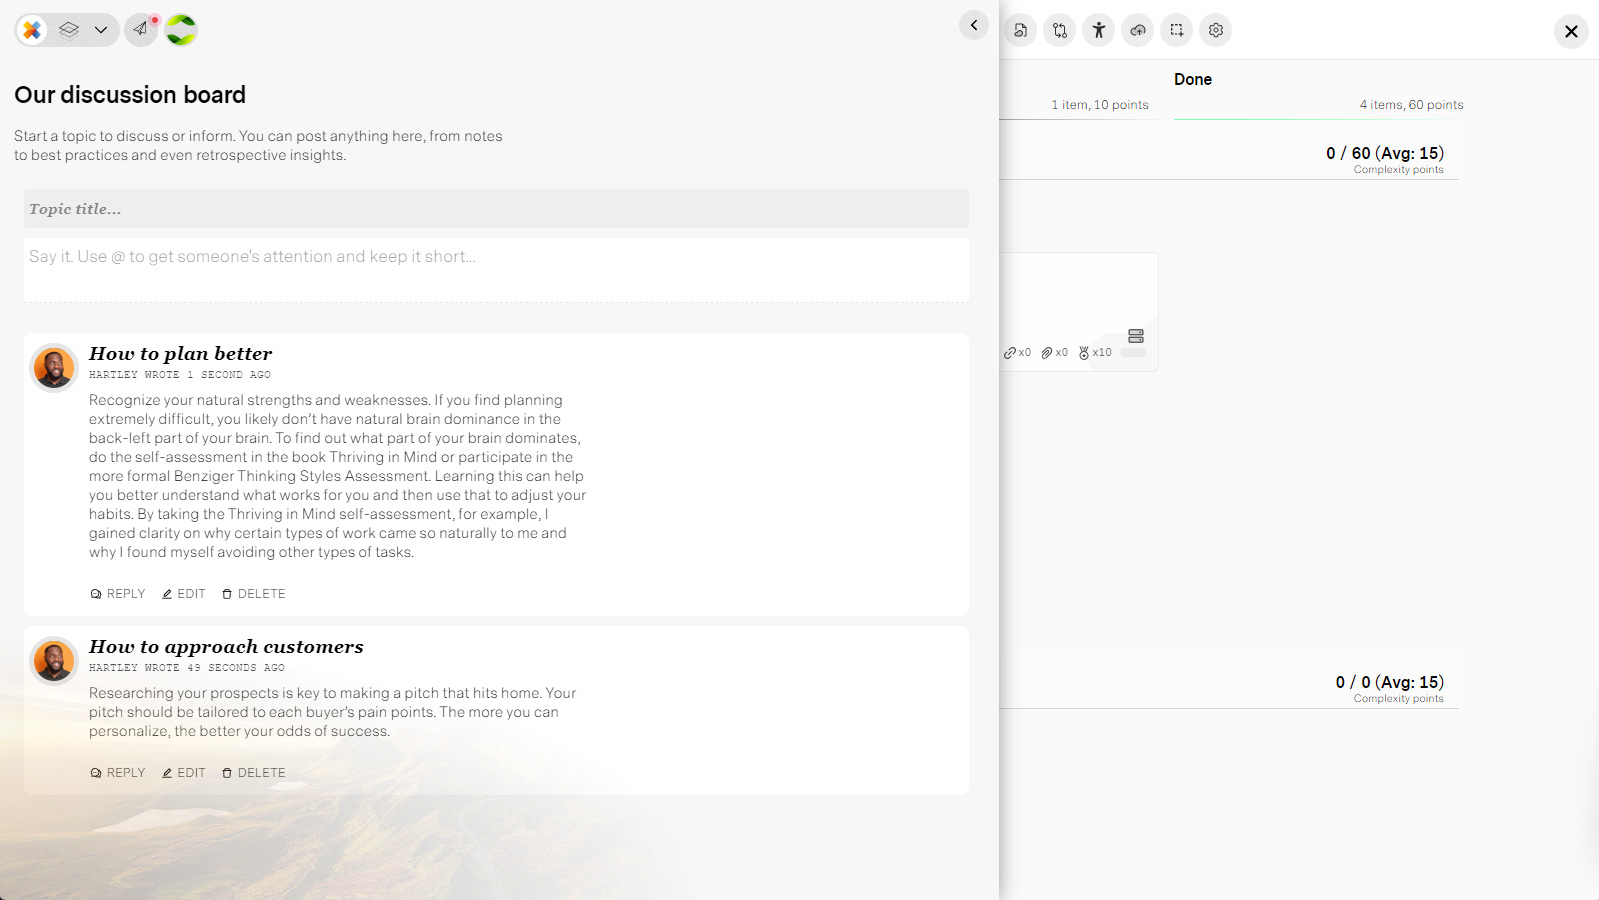
Comments/Discussions
Create discourse, solve problems, and create topics for learning and training within your project workspace. Knowledge becoems contextual and easily access by everyone. One less app to worry about.
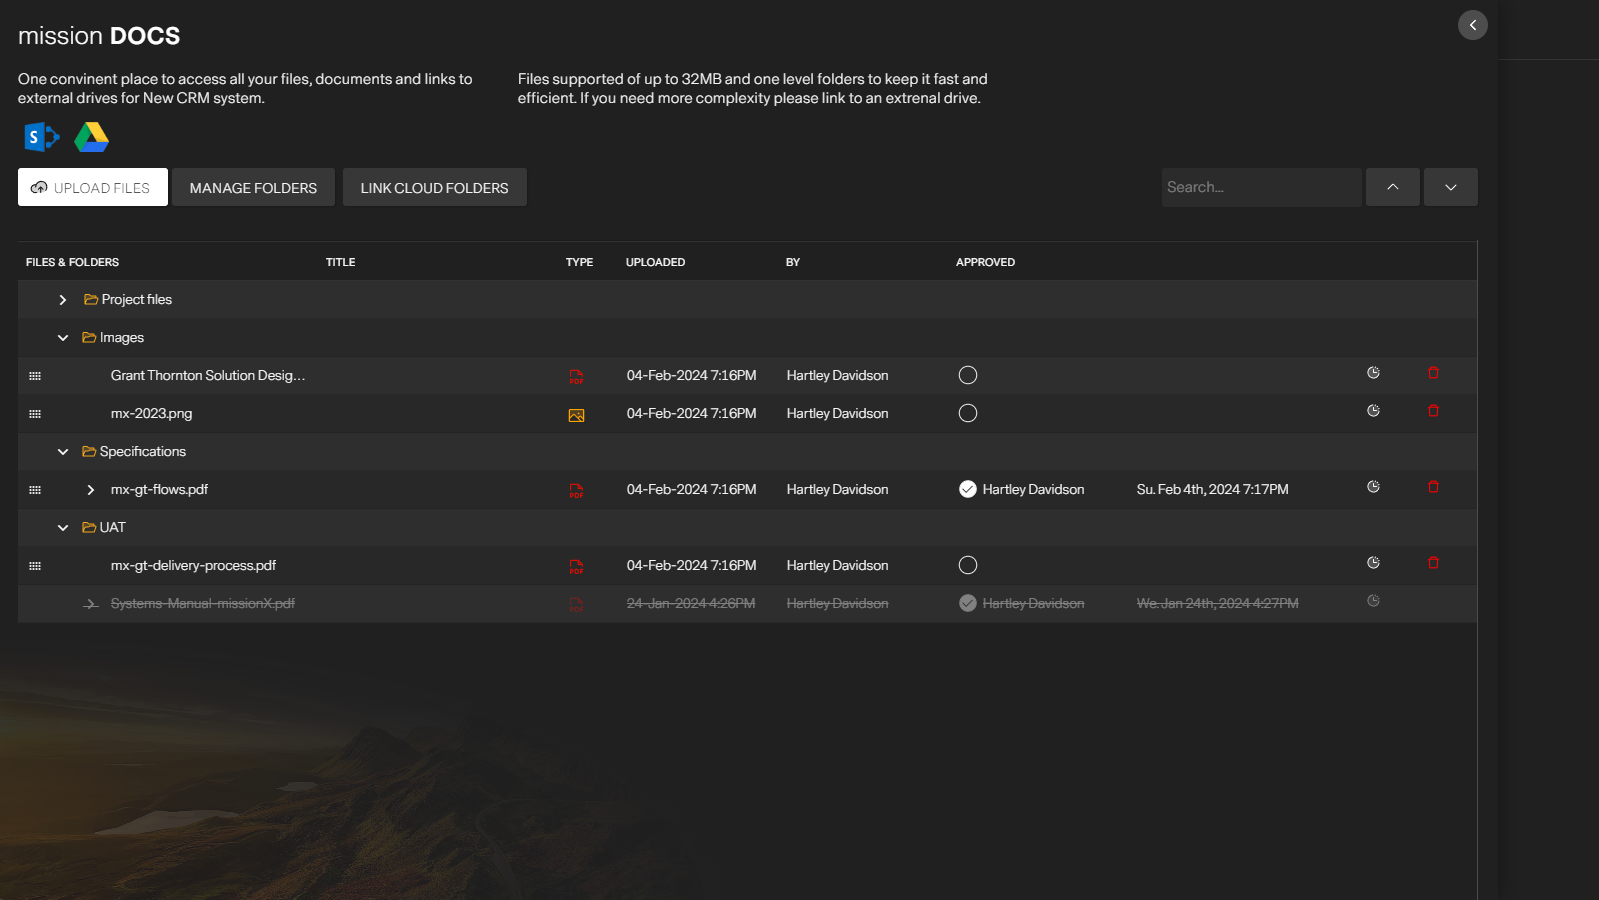
mission DOCS
Manage project files, document versions and approvals in missionX or add links to external drives and folders for easy access from tasks or the document's panel
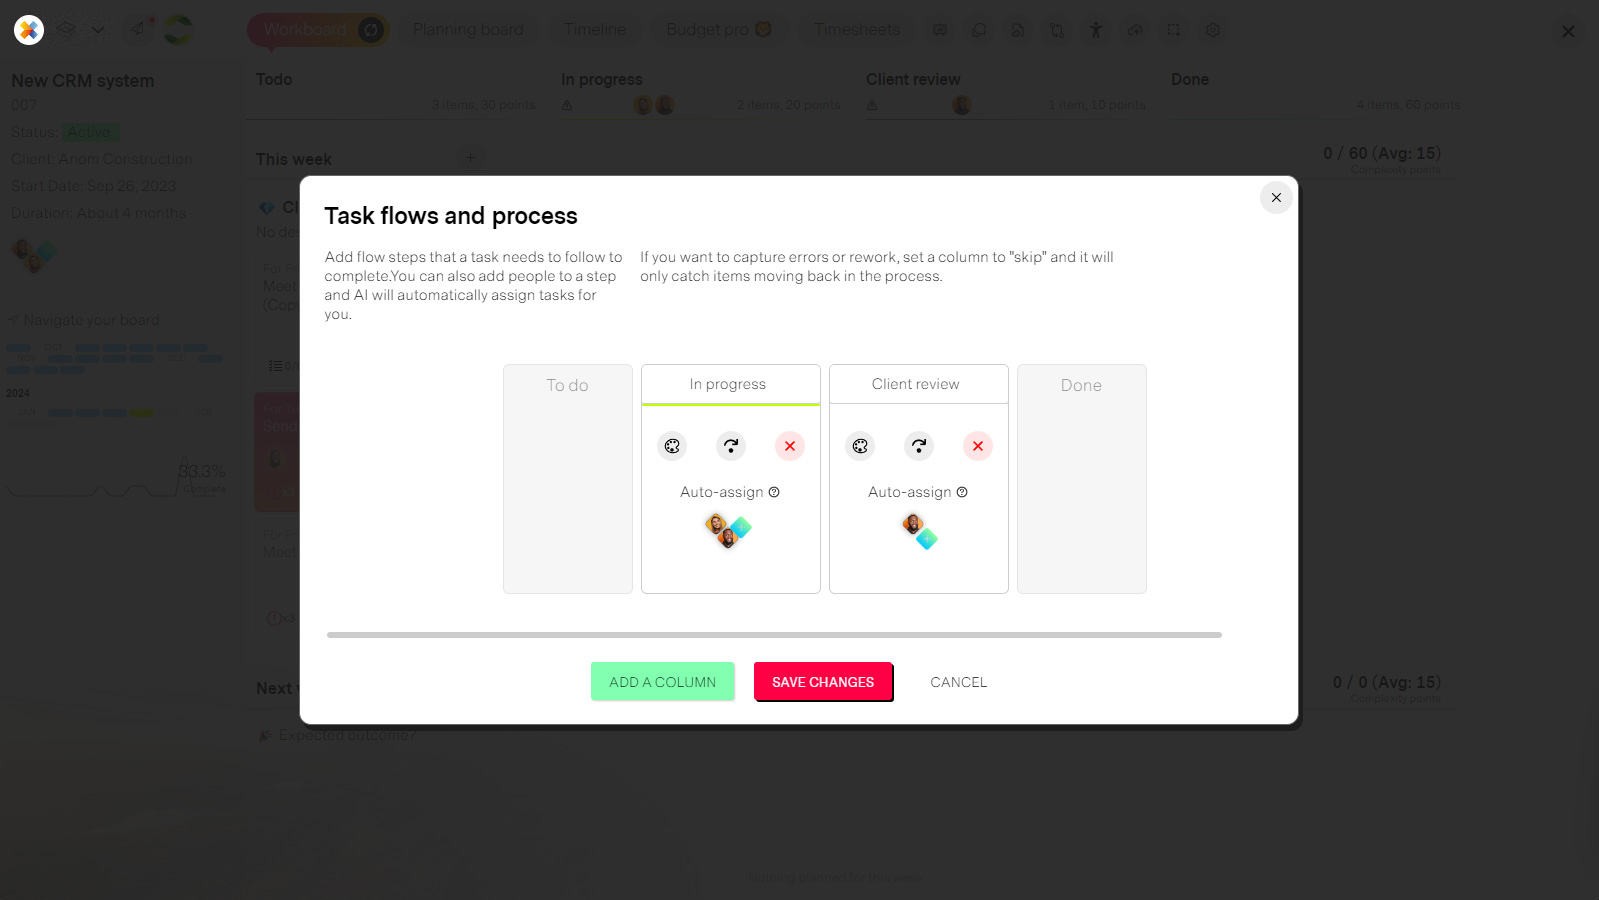
Process Flow Maker
Manage your projects process flow. Add a title for each step, assign a color and optionally define who should automatically be assigned tasks when they land in their column. You can also set a column to skip forward and only capture steps going back in the process like "Re-rework" or "Changes needed"
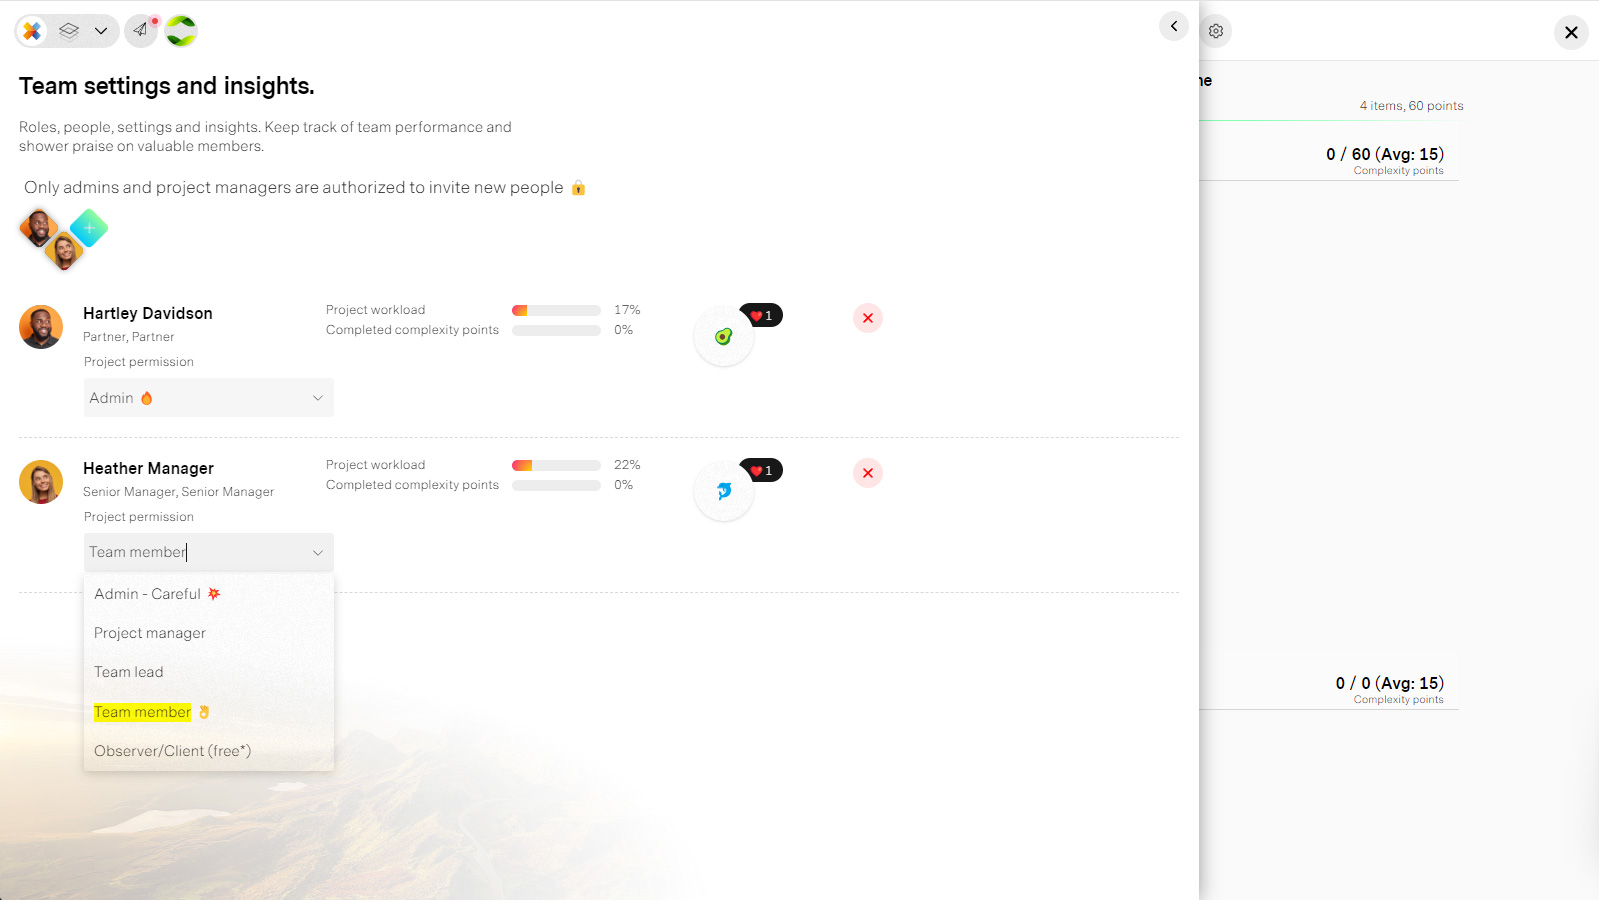
Manage the project team
A complete view of your team where you can manage permissions, shower praise for hard work and see each person's workload
Visualize your project roadmap
The roadmap is the highest level of your project plan's activities. Usually agreed upon by the project manager and senior project stakeholders. This is where you map out and organize the pases or teams of your project.
An advanced yet incredibly simple drawing tool to visualize Workstreams, Themes, Phases, Milestones, PODs and any dependencies between them.
Your project roadmap is critical becasue each line is broken down into Epics, or Buckets of work.
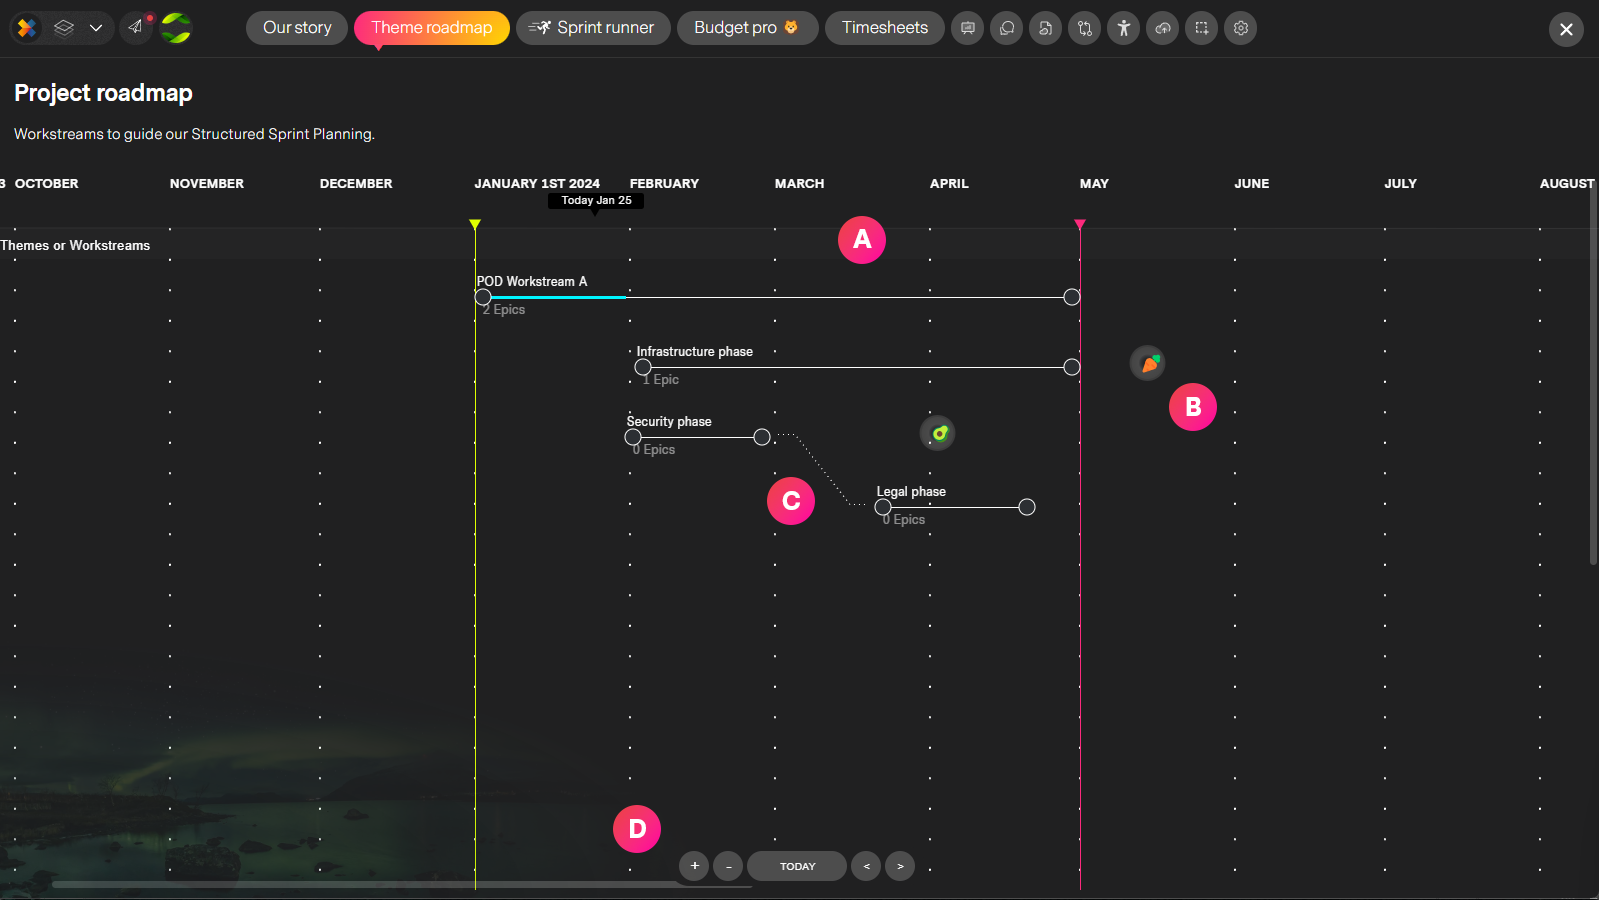
| Label | Feature | Description |
| A | Lines and Milestones | A "line" can represent anything from Workstreams, Phases, Themes or PODs. Basically any work that needs to be planned must have a line on the roadmap. These then break down further to Epics or Buckets of work and those Epics breakdown to Tasks and Stories To draw a line just press "A. You can then drag and resize to change dates and duration. |
| B | Milestones | You can place a milestones to your timeline by pressing M. You can then drag it to change the milestone date. |
| C | Dependencies | Just click on the circles at the end of each line to create dependencies between them. You can create basic dependencies, like one line must complete before the other starts or start-to-start dependencies meaning two lines must start at the same time. If a dependency exists when changes to a line's dates are made, the dependency line will also be updated automatically. To delete a dependency simply click on the dependency line. |
| D | Timeline controls | Zoom, expand and jump to key dates like plan start date, end date and today. |
Epic timeline
An Epic timeline represents the breakdown of each line in your roadmap in to categories of work. It is one more step of breaking down work into manageable units to understand, visuialize and validate the scope of what is being planned. This is where project teams or PODs alomng with the project manager or scrum master can break down the main activity into all the peices they need to complete the roadmap activity.
Example: Migration to a cloud-based server, may have the following epics. "Finding the best coud providers", "Choosing our cloud provider", "Moving data to the cloud", and so on and so forth
A timeline in Agile? Sort of. Ideally Epics represent groups of tasks and stories that need to be completed. So an Epic might be "New customer portal design". Then you would break up you Epic into the work thast needs to get done to complete it (tasks and stories)
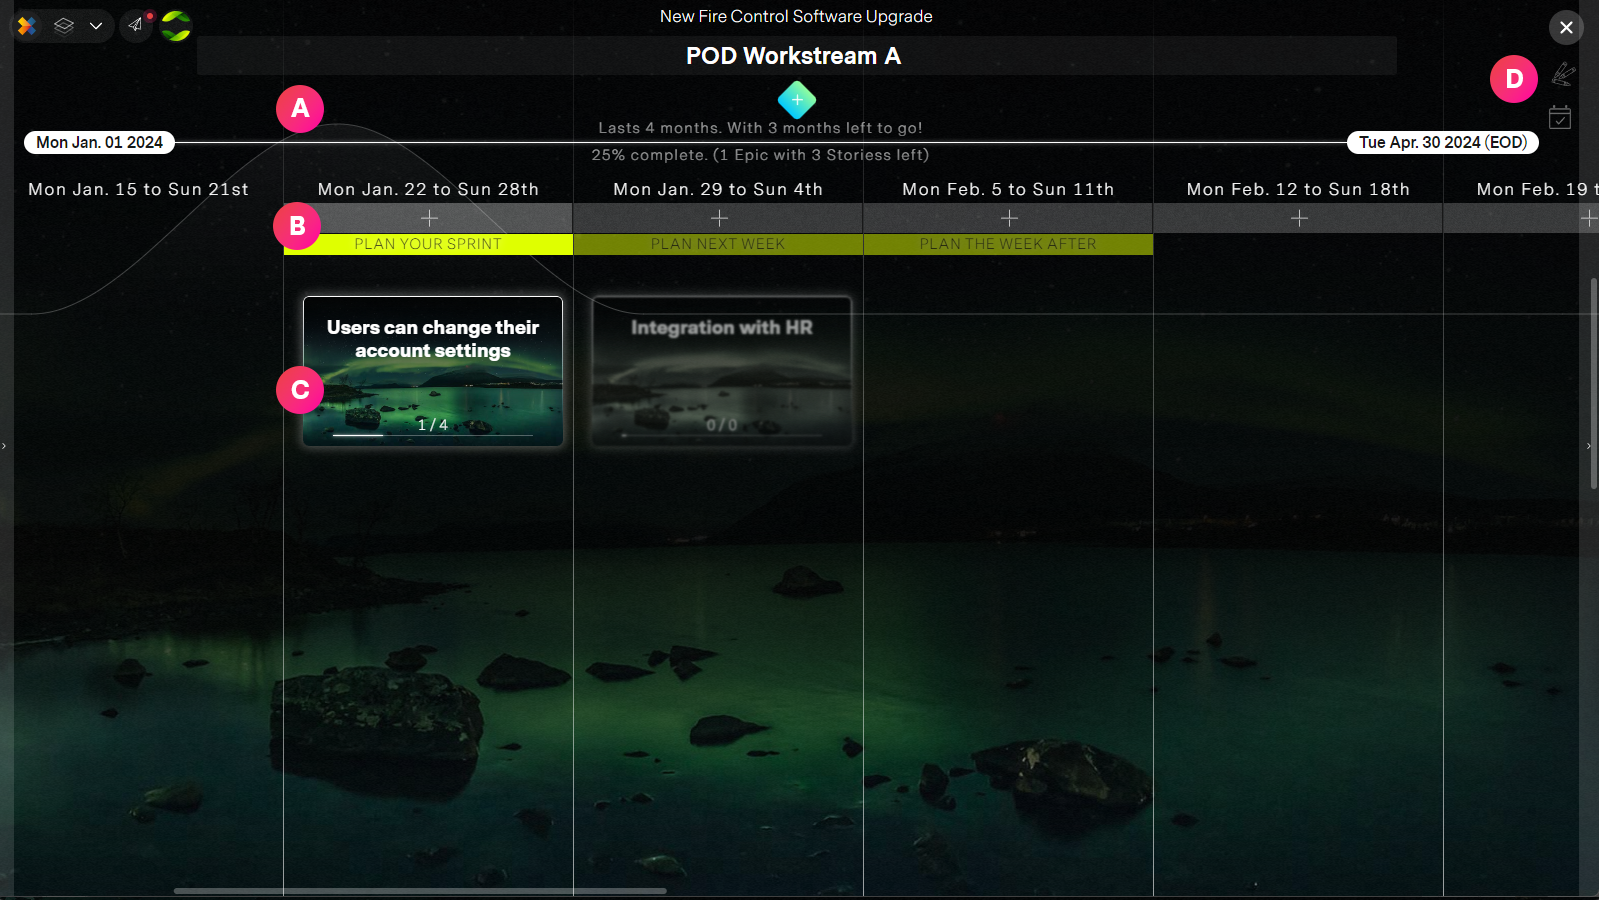
| Label | Feature | Description |
| A | Timeline header | Here you can change the title of your timeline and define the team or "workstream" involved with this phase. The header also doubles as an insight tool as to the duration of the phase with insights on progress and peak busy weeks. |
| B | Weekly columns | Your timeline is broken down into weeks. Each week allows you to add an Epic to it using the plus sign. You do not have to be exact with your weekly breakdown. In fact, you can put all your Epics in week one and missionX will automatcially roll them over until completed or set to "Inactive" from your Epic workboard What the week columns are actually doing is determining which Epics can be worked on during Sprint planning. This way the PM and Scrum master can align as to what is being worked on and when. You can "Plan your Sprints" within three weeks of today. Planning out any further is not supported as we have already bent the rules of Agile enough at this point. |
| C | Epic tiles | Each square tile is an Epic (Bucket of work). These Epics can be dragged and dropped to other weeks as you wish, except if you have items already planned. Plan or don't plan weekly, but once a Sprint has progressed and there are active tasks and stories in Sprint Runner there can be no changes to the Epic. Remember you can only plan sprints with Epics that are in the week you are planning. So if you don't plan on working on something till near the end of the project... push it down the timeline. |
| D | Schedule sprint planning | You can set a reminder to have the team meet for Sprint planning on a regular basis by clicking on the calendar icon. |
Epic workboard
This is the final breakdown of a roadmap line. Where we add Stories and Tasks to our Epic.
This is where team leads, the scrum master or the project manager can create mini backlogs of work-to-be-done and estimate the complexity of each task by the team.
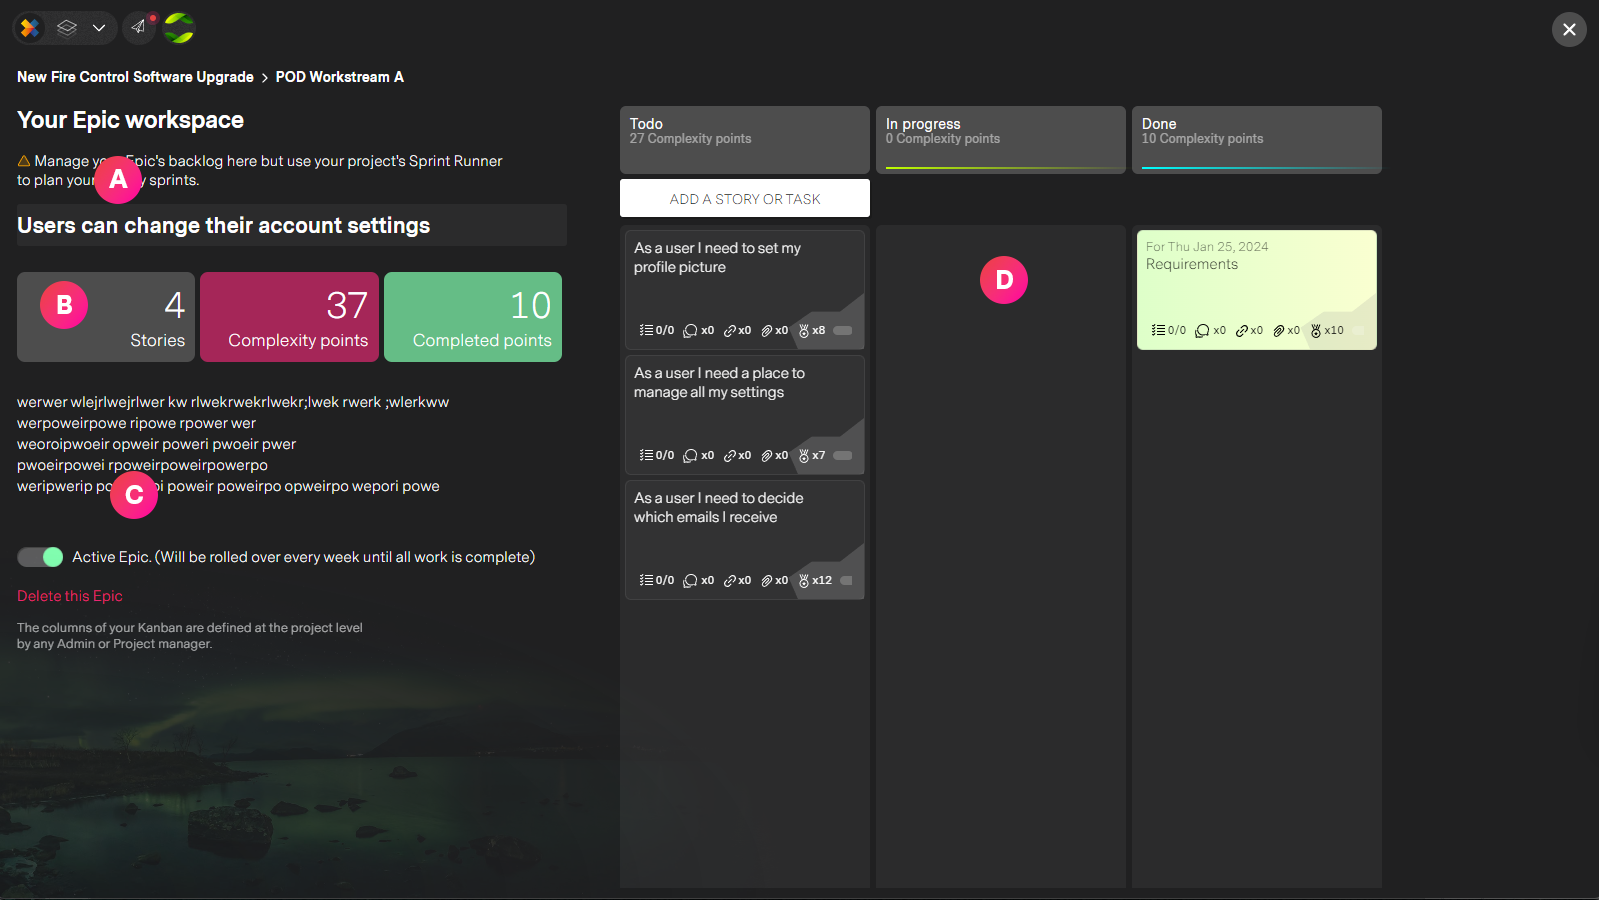
| Label | Feature | Description |
| A | Name of the Epic | Select a short precise name for your Epic that can be easily recognized in a board or in a dropdown. The best names will describe an outcome, for example: "Users can manage email preferences" |
| B | Insights | Progress indicators for your Epic |
| C | Settings and summary | Optionally add a short description if you wish detailing what you hope to achieve and some basic information of what's involved. The controls allow you to set the Epic to Active or Inactive and even delete the Epic. Setting an Epic to inactive will freeze it, meaning it will not appear as an option when Sprint planning and will not be rolled over every week. |
| D | Process flow | Each project in missionX can define a process flow. In structured Agile this is where the process is visualized as a mini-kanban. The planning and estimating is done in Sprint Runner but the progression through the process is viewed here. |
Sprint Runner
Collaborative visual tools for planning and estimating your Sprints in real-time
Select a roadmap Theme or Phase, select one of its Epics and then team members can drag, drop and resize tasks on to the Sprint Board.
Sprint Runner is intelligent in two ways. First it limits Sprint planning to overlapping roadmap lines and Epics within a 3 week period from the Epic timeline. Second, it automatically calculates your chance of success. AI calculates your risk score in real-time as you plan your week and gives you insight if you should be taking on more work or giving the team member more time.
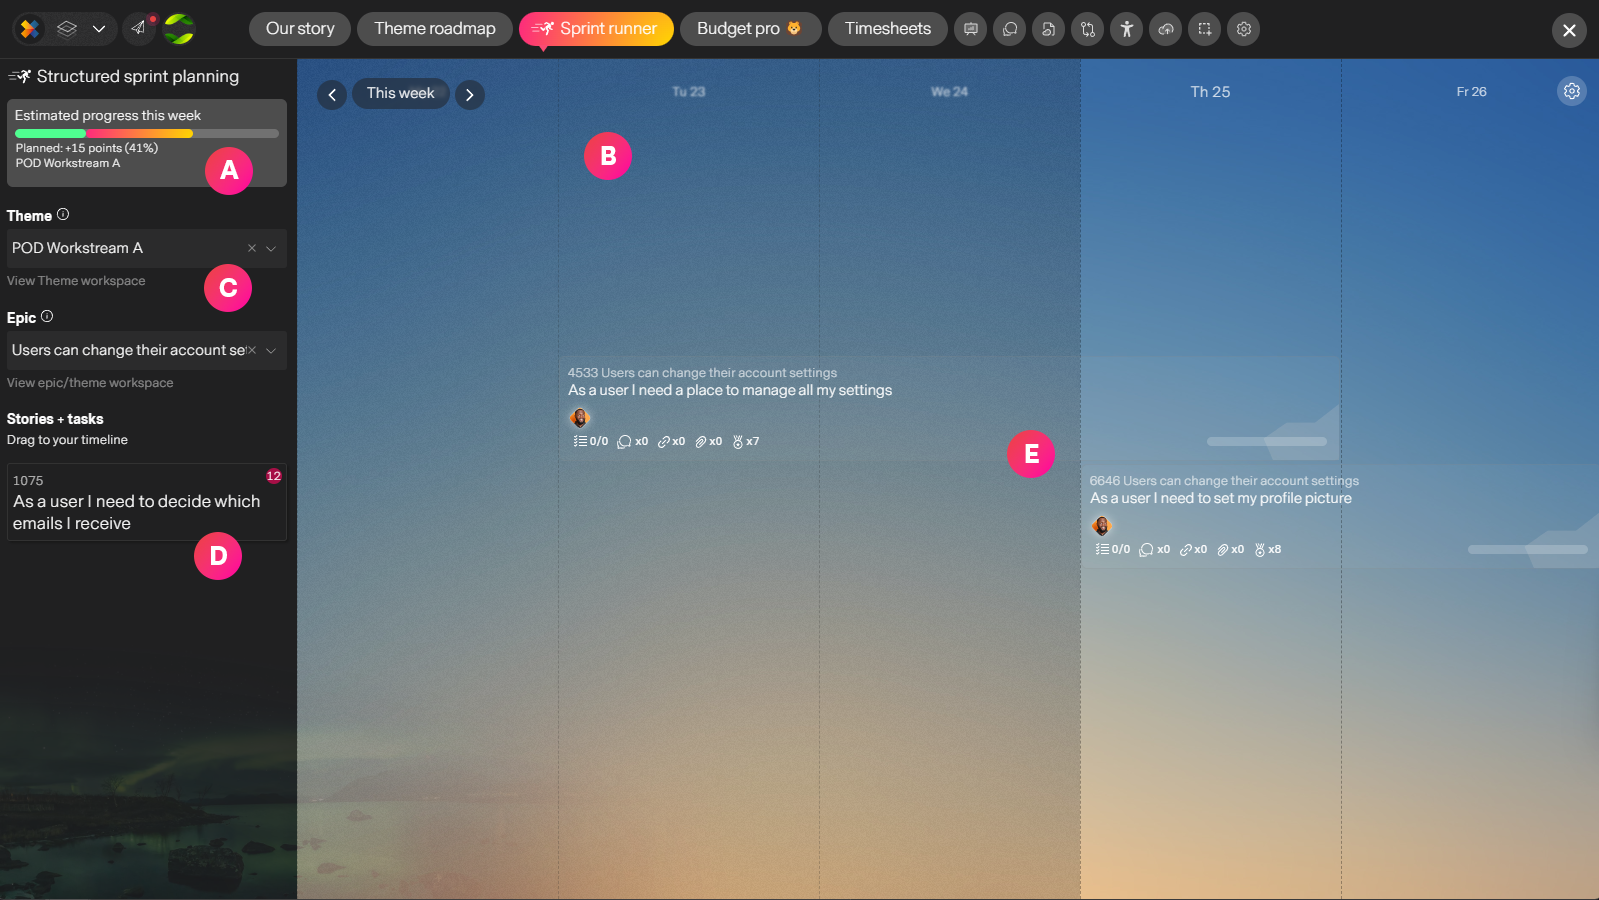
| Label | Feature | Description |
| A | Outcome report | Indicators of the planned progress for this Sprint |
| B | The Sprint board | This is your Sprint week. You can view just weekdays or all days. You and jump backwards to see what was completed in previous weeks and forward to plan up to 3 weeks ahead... you should try and limit it it two. |
| C | Filter your Stories and Tasks | Select the theme, phase or workstream, then the epic you plan to work on and you will get a list of relevant Stories and Tasks |
| D | Unfinished Stories and Tasks | All open tasks related to a selected Epic. Team members can drag and drop tasks on the board in real-time to plan them for the week. |
| E | Planned work | Drag and drop tasks to change estimated start and end date, then resize to change duration. This allows you to work to a rough timeline. Although members can work on any task, in any order after Sprint planning is complete, AI will prioritize work to nudge people into completing work as expected. At the end of the week, any unfinished tasks will automatically be removed from the timeline and put back into the Epic backlog for re-planning. SO a Story or task can technically last for weeks (but it shouldn't) |
Automate a process
Making a linear process to follow and track task progression is easy when using the missionX flow maker. Each column represents a step in your process and has special features to help you automate tasks flowing through it.
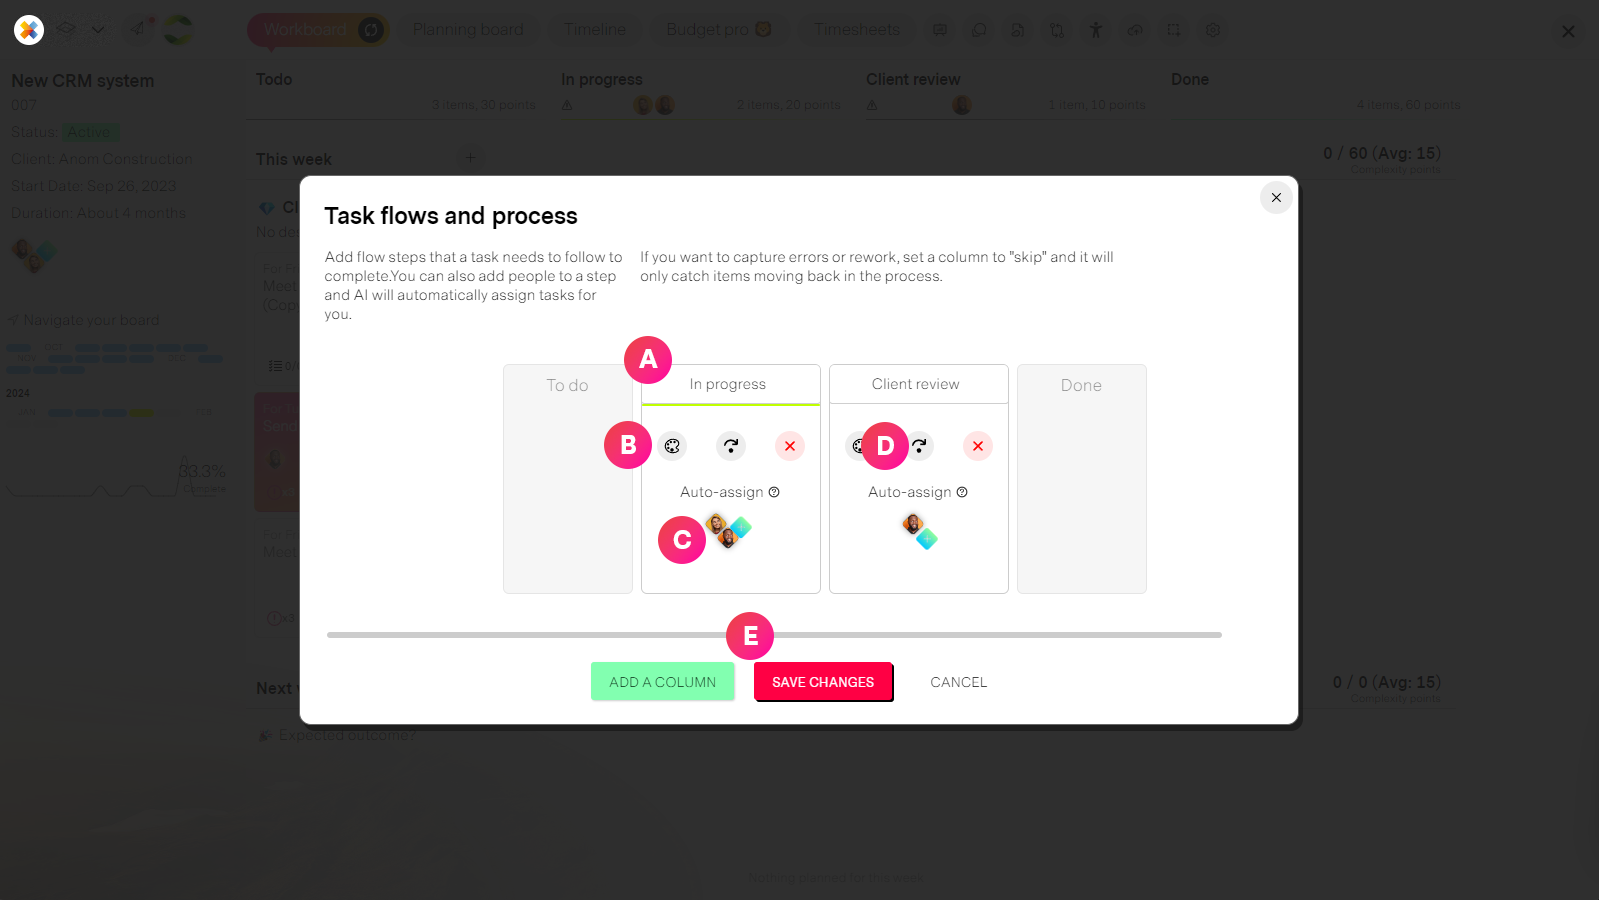
| Label | Feature | Description |
| A | Columns (Steps) | These are the steps of the process in the order your define. If you want to change the order, simply drag and drop to reorder. |
| B | Column controls | Optionally select a color for your colum to differntiate tasks on your workboard. Delete the column. If you delete a column, any tasks in the column will be automatically taken back to the previous step. |
| C | Auto-assign | If you choose to assign people to a column, then any tasks moved to this part of the process will be automatically be assigned to the person with the most capacity. An example of this would be if you have an "Approval" step, then the person who is in charge of approving work will automatically be assigne the task and notified. |
| D | Skip steps | In some cases you may want tasks to skip steps going forward in the process but allow for items sent back in the process. A common scenario for this is "rework" or "changes needed". An example might be if your process looks like: Design, Changes and Client approves. "Changes" would then skip and tasks would go directly for approval. If for some reason it is not approved then you can send it back to "Design" This is extremly helpful if you want to spot problems or track how much volume is being sent back in the process by looking at the colum header's details. |
| E | Flow controls | Add a a new column from here and save any changes before exiting. Please remember to save your changes. This is one of the few places where missionX does not autosave for you. |
Tracking progress
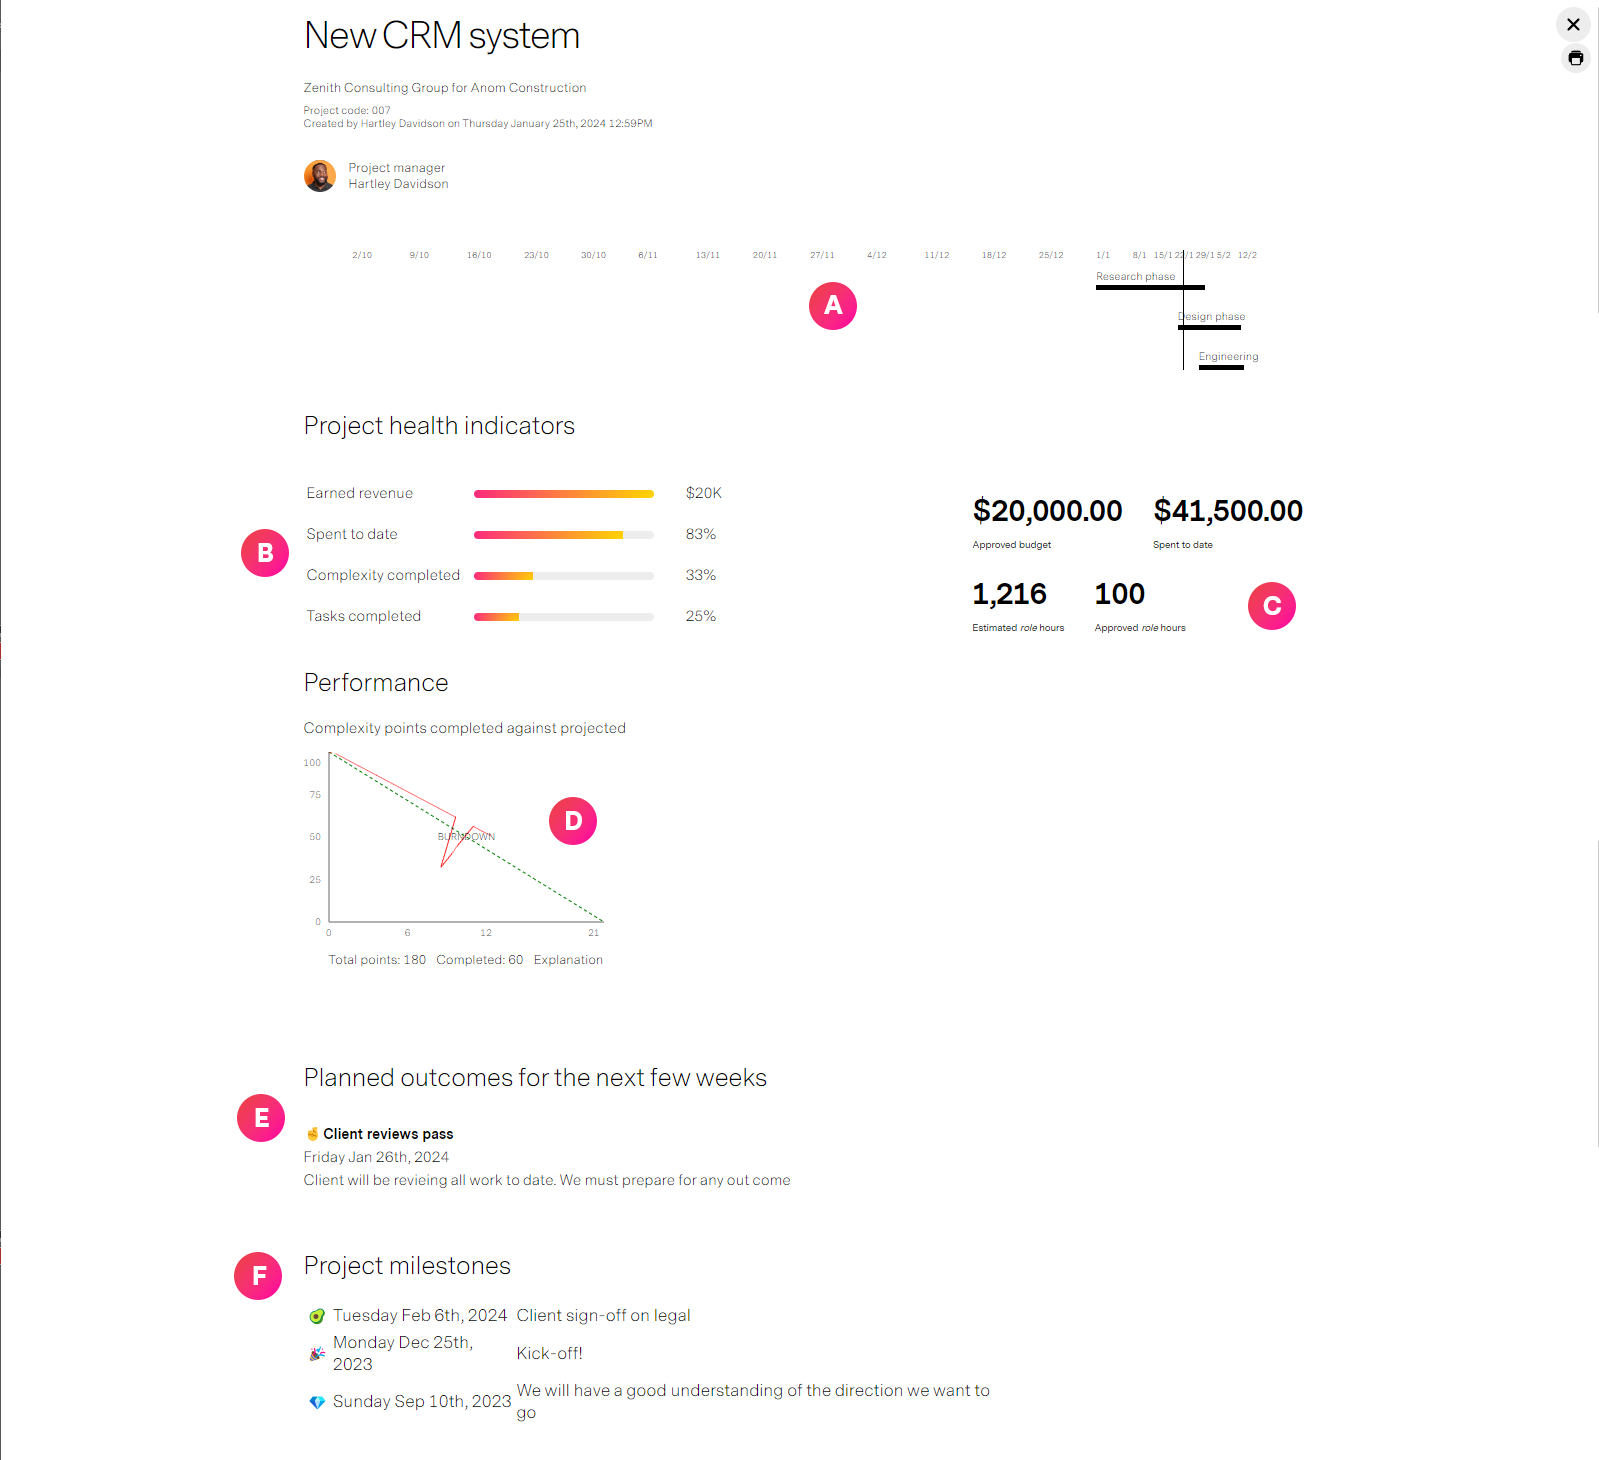
Reporting for your project and tracking progress is extremly easy because it's done for you. With one click you can create a beutiful, sophisticated report for sharing with you're team, management or clients.
There are many ways to view reports in missionX but here we are looking at the Client report from your project workspace navigation bar.
| Label | Feature | Description |
| A | Project timeline | If you have defined phases with dates in your Planning board then they will appear here to show completion progress |
| B | Health indicators | An overview of some key indicators like earned revenue (if the project is billable), spent to date (if you are tracking costs) and complexity completed. Complexity points define how much work is required to complete a task and allows you to guage how much effort will be required to complete remaining tasks |
| C | Approved vs Actual | For many client projects you will need to track performance against approved budget and hours. missionX summarizes it here for you by incorporating timesheet data if timesheets are enabled. |
| D | Burndown chart | Your Burndown chart represents the amount of work defined vs how much of that work has been completed. This is all based on Complexity points that are defined for each task and not the number of tasks. This is important because you may have 20 tasks left but they may all be extremly hard to complete and require a long time so number of tasks is not the best way to track work completion. The bottom axis is the weeks in your project, the Y axis on the left is how many complexity points are planned for. The middle green diagonal line is how many points need to be completed each week for you to deleiver on time. Now the red line is your burndown, how are you doing completing work on a weekly basis and at what rate you will finish. It should closely match the green line. It the red line is pointing before the green line great, you are finishing early but if the red line is trending to the right of the green line. you are heading for delays and you will need to complete more work to get it back on track. Structured Agile projects will show a Burndown chart for every workstream, POD or phase in your project |
| E | Outcomes | A summary of what you plan to accomplish in the next few weeks. |
| F | Project milestones | You can add milestones from your project timeline. These are different than outcomes in that they represent key momnets for your overall project like "Client sign-off", or "Go live" |